Why Alamos Gold Shares Jumped 7% Yesterday
Alamos Gold shares climbed 7% Thursday, pushing back toward their 52-week high as traders positioned ahead of next week’s earnings report. The move extends a strong start to 2026 for Canadian gold producers, with Alamos Gold Inc. (TSX: AGI) now among the TSX’s better-performing large-cap miners year-to-date.
What Just Happened
Advertisement

Get up to $2,000 cash back
Open and fund a new Qtrade account with promo code SPRING26. Offer ends July 31, 2026.
Alamos Gold Inc
AGI.TO
AGI.TO
Alamos Gold Inc
 WealthAwesome
Market cap
$17.51B
P/E
11.7x
52W high
$75.63
52W low
$32.99
1W change
-8.94%
Beta
1.33
Analyst Price Targets
Based on analyst covering AGI
Wall Street analysts forecast AGI stock price to rise 74.4% over the next 12 months.
Consensus
BullishBased on avg. target vs last close (formal rating unavailable for Canadian listings)
Avg. Target
C$71.24
+74.4% Upside
Current Price
C$40.85
Last close
Analyst ratings and price targets are updated periodically. Not financial advice.
Wealth Awesome Price Forecast
WA ModelStatistical 90-day price range based on AGI's historical volatility
30-Day Vol
82.0%
Annualized
90-Day Vol
64.5%
Annualized
Trend (90d)
-50.0%
Annualized drift
90d Mean
C$34.17
Expected price
| Horizon | Expected | 68% Range (1σ) |
|---|---|---|
| 30 trading days | C$38.49 | C$29.01 – C$51.07 |
| 60 trading days | C$36.27 | C$24.31 – C$54.10 |
| 90 trading days | C$34.17 | C$20.94 – C$55.76 |
Methodology: Range is calculated using 30-day realized volatility via geometric Brownian motion (log-normal model). 68% band = ±1σ, 95% band = ±2σ. This is a statistical model, not a prediction. Past volatility does not guarantee future results. Not financial advice.
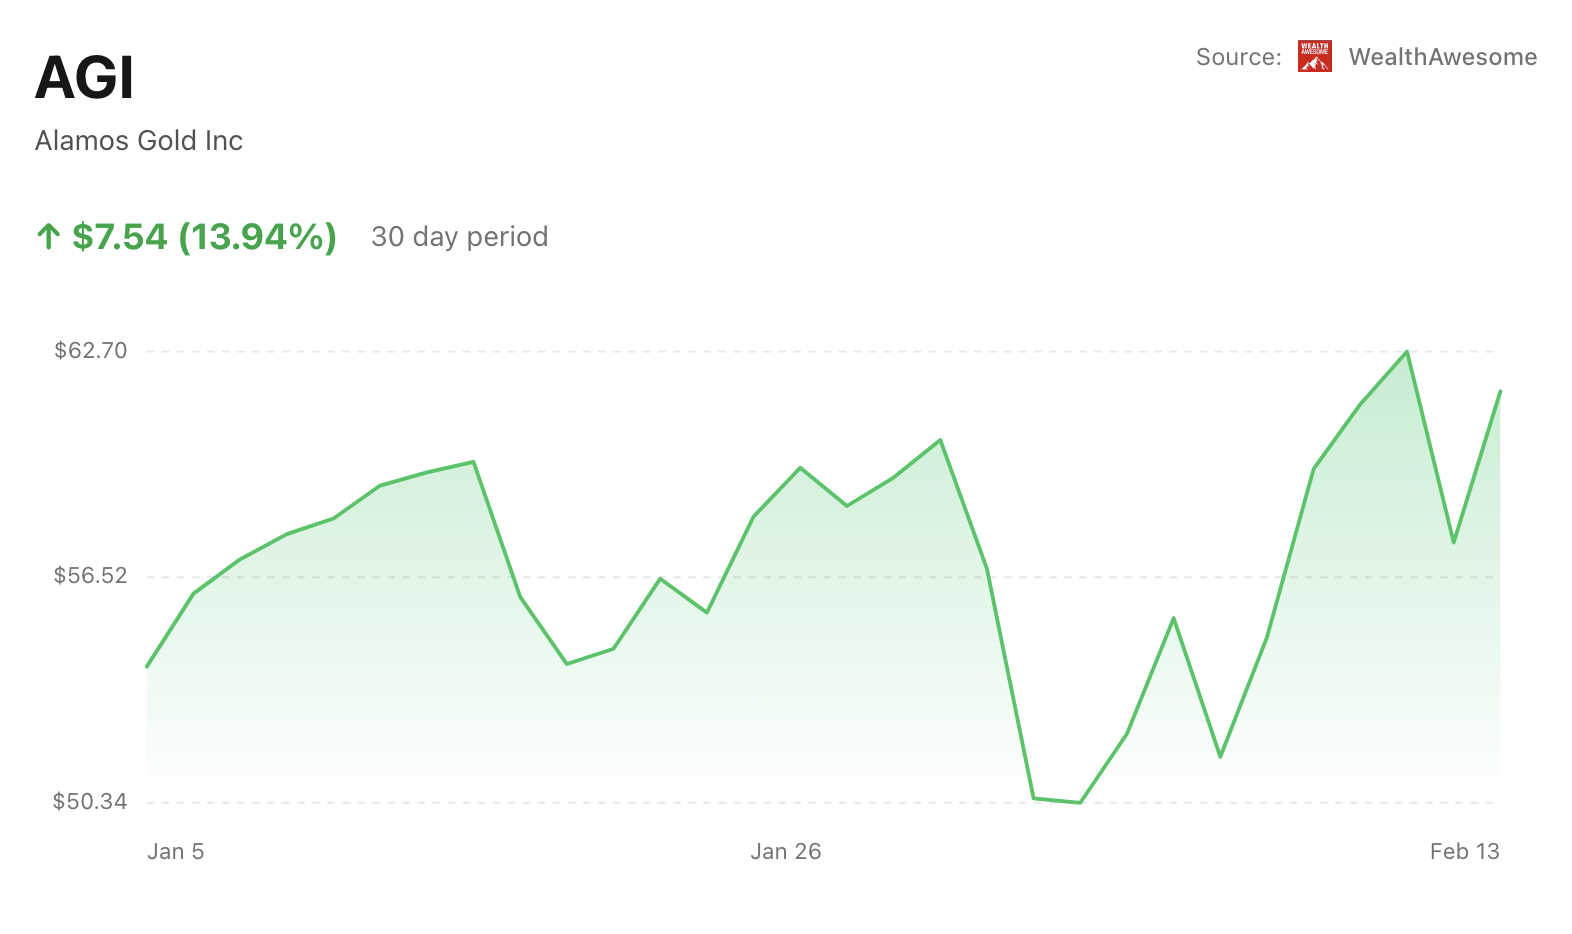
• Alamos Gold rose 7.20% on February 13 to close at $61.61.
• The stock is up 12.26% over the past week and 16.91% year-to-date.
• Shares are trading above their 50-day moving average of $55.08 and 200-day moving average of $44.29.
• The rally puts the stock within roughly 3% of its 52-week high of $63.34.
There were no company-specific announcements tied to the advance. The next earnings report is scheduled for February 18.
What’s Driving the Move
The rally appears to be earnings positioning rather than reaction to new headlines.
Alamos has delivered steady operating performance over the past year, generating $1.61 billion in trailing twelve-month revenue and $955.1 million in EBITDA, with a profit margin of 33.46%. Diluted EPS stands at 1.74 and return on equity at 14.27%.
Wednesday’s pullback — when shares briefly touched a 52-week high before closing at $57.47 — was quickly bought. Thursday’s rebound suggests traders were waiting for a dip ahead of results.
With gold prices holding firm and margins intact, investors are leaning into producers that have demonstrated cost control and consistent cash flow.
The Key Level
$63.34
That’s the 52-week high. A decisive move above it would mark a fresh breakout just days before earnings and could reinforce short-term momentum.
What Matters Now
All eyes shift to February 18.
If management confirms stable production and disciplined costs, shares could attempt to clear their 52-week high. After a 12% gain in a week, however, expectations are elevated. Any weakness in output, costs, or guidance could prompt a pullback toward the mid-$50s.
Bottom Line
Alamos Gold is rallying into earnings and pressing against a critical resistance level. The next update will determine whether this move becomes a sustained breakout — or simply a pre-earnings spike.
Advertisement