Bonterra Energy Corp (BNE : TSX)
Common Stock
$5.48
CAD
-0.05 (-0.90%)
Last updated: 2026-07-20
BNE
Bonterra Energy Corp
Performance
1 Day
-0.90%
1 Week
-2.49%
1 Month
-7.74%
YTD
+19.13%
Key Statistics
Market Cap
$200.52M
52W High
$7.64
52W Low
$3.33
P/E Ratio
-
50 Day MA
$6.19
200 Day MA
$5.23
Beta
1.05
Dividend Yield
-
Technical Indicators
Price vs 50-Day SMA
Price vs 200-Day SMA
Recent Price History
| Date | Open | High | Low | Close | Adj Close | Volume |
|---|---|---|---|---|---|---|
| 7/20/2026 | $5.51 | $5.53 | $5.43 | $5.48 | $5.48 | 12,976 |
| 7/17/2026 | $5.39 | $5.55 | $5.31 | $5.53 | $5.53 | 80,455 |
| 7/16/2026 | $5.58 | $5.58 | $5.33 | $5.42 | $5.42 | 43,637 |
| 7/15/2026 | $5.53 | $5.53 | $5.30 | $5.45 | $5.45 | 36,045 |
| 7/14/2026 | $5.78 | $5.78 | $5.53 | $5.62 | $5.62 | 33,135 |
| 7/13/2026 | $5.40 | $5.62 | $5.28 | $5.62 | $5.62 | 117,627 |
| 7/10/2026 | $5.50 | $5.50 | $5.25 | $5.26 | $5.26 | 34,730 |
| 7/9/2026 | $5.75 | $5.78 | $5.48 | $5.56 | $5.56 | 32,330 |
| 7/8/2026 | $5.47 | $5.75 | $5.47 | $5.72 | $5.72 | 53,316 |
| 7/7/2026 | $5.28 | $5.50 | $5.22 | $5.49 | $5.49 | 13,114 |
Analyst Price Targets
Based on analyst covering BNE
Wall Street analysts forecast BNE stock price to rise 58.5% over the next 12 months.
Consensus
BullishBased on avg. target vs last close (formal rating unavailable for Canadian listings)
Avg. Target
C$8.69
+58.5% Upside
Current Price
C$5.48
Last close
Analyst ratings and price targets are updated periodically. Not financial advice.
Wealth Awesome Price Forecast
WA ModelStatistical 90-day price range based on BNE's historical volatility
30-Day Vol
50.2%
Annualized
90-Day Vol
46.7%
Annualized
Trend (90d)
-50.0%
Annualized drift
90d Mean
C$4.58
Expected price
| Horizon | Expected | 68% Range (1σ) |
|---|---|---|
| 30 trading days | C$5.16 | C$4.34 – C$6.14 |
| 60 trading days | C$4.86 | C$3.81 – C$6.21 |
| 90 trading days | C$4.58 | C$3.40 – C$6.19 |
Methodology: Range is calculated using 30-day realized volatility via geometric Brownian motion (log-normal model). 68% band = ±1σ, 95% band = ±2σ. This is a statistical model, not a prediction. Past volatility does not guarantee future results. Not financial advice.
About Bonterra Energy Corp
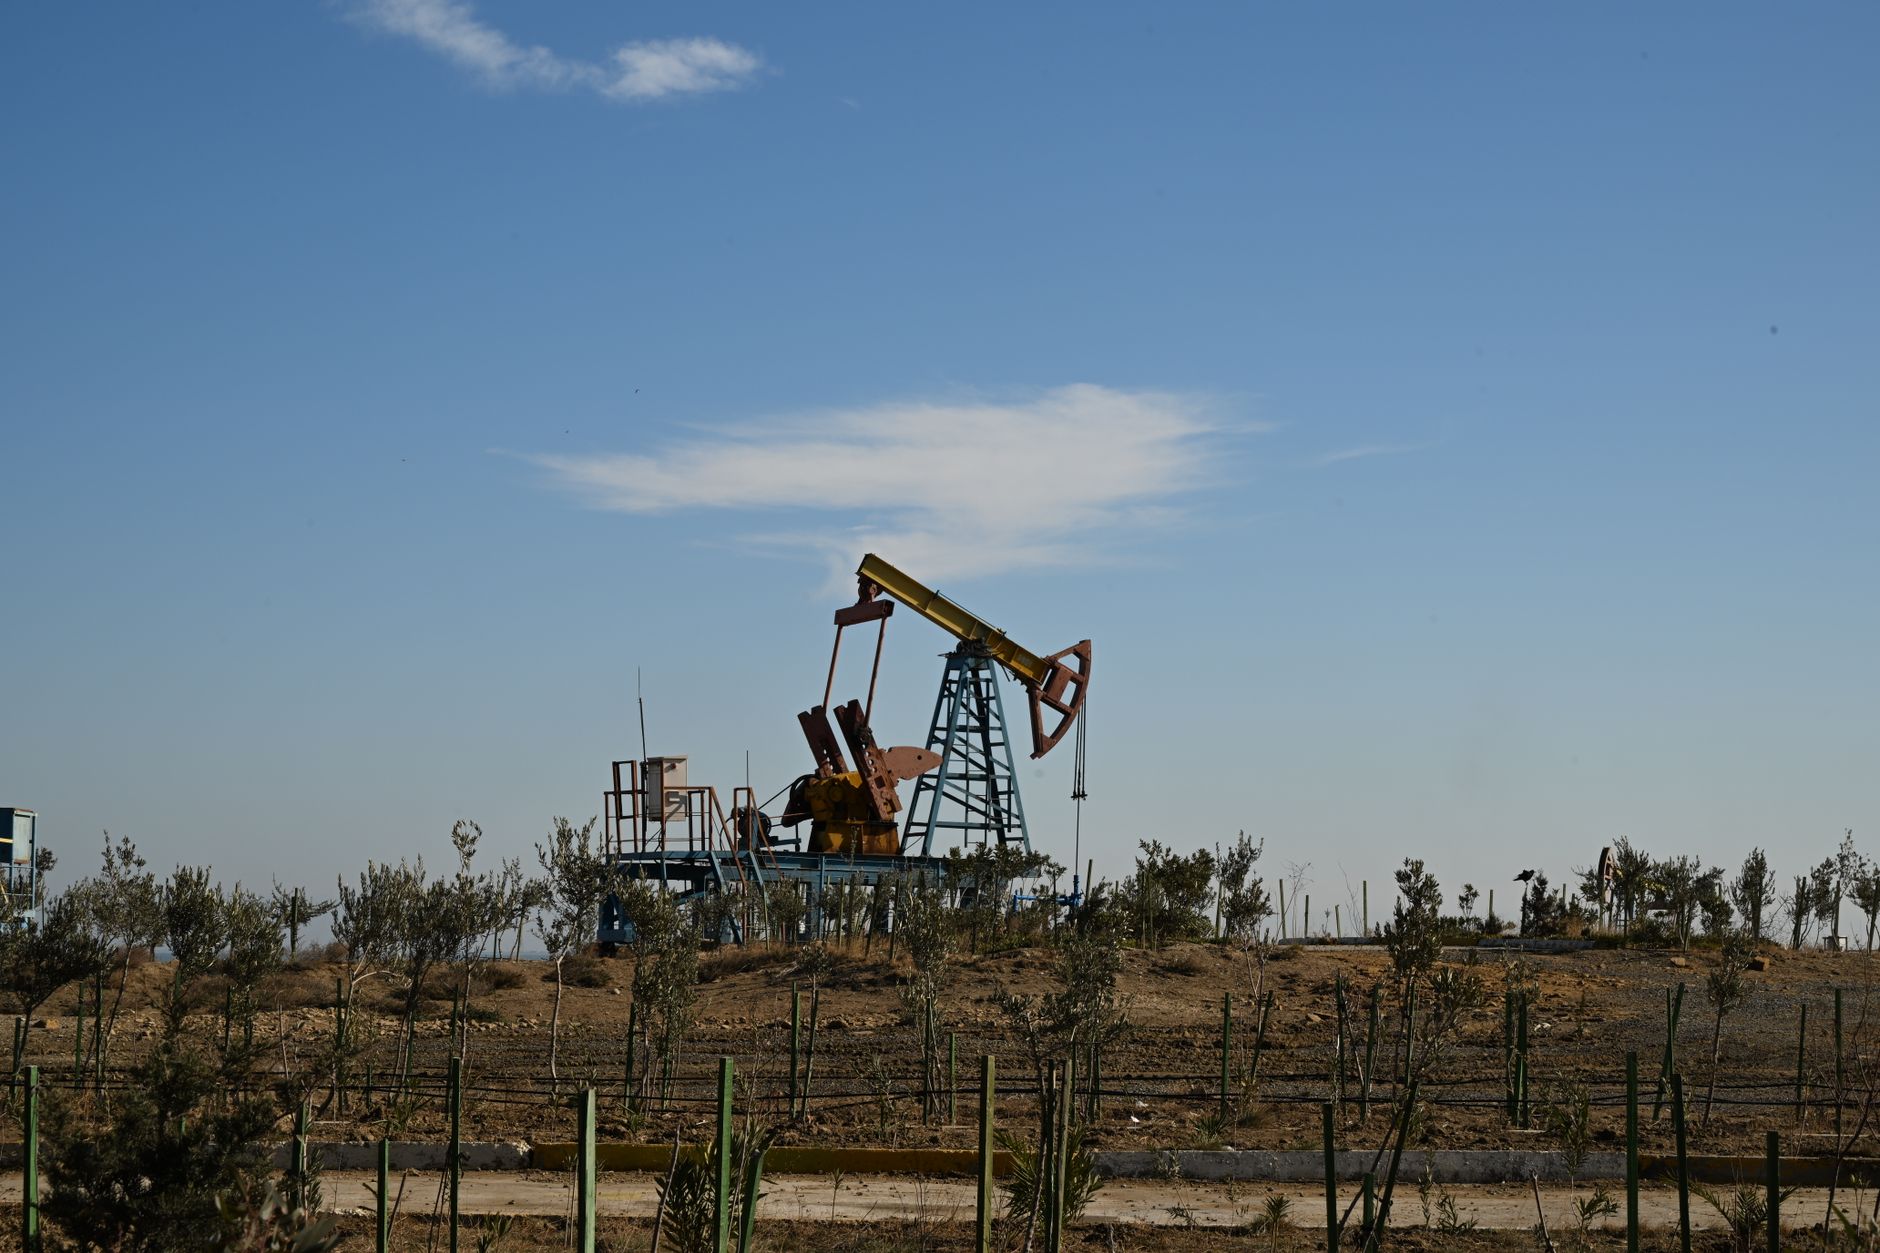
Bonterra Energy Corp., a conventional oil and gas company, engages in the development and production of oil and natural gas in Canada. Its principal asset is the Pembina Cardium, a conventional oil field at the Pembina and Willesden green fields located in central Alberta. Bonterra Energy Corp. was incorporated in 2013 and is headquartered in Calgary, Canada.
Financials
- Revenue (TTM)
- $215.00M
- EBITDA
- $80.54M
- Profit Margin
- -11.23%
- ROE (TTM)
- -4.64%
- EPS (Diluted)
- -0.67
- Book Value
- 14.00
Classification
- Sector
- Energy
- Industry
- Oil, Gas & Consumable Fuels
- Group
- Energy
Advertisement
7 stocks to buy and hold forever
Blue-chip dividend stocks for long-term wealth building.
Get the FREE ReportExplore More
Common Questions About BNE
Articles Featuring BNE.TO
Latest articles and analysis covering BNE.TO
What's Going On With Bonterra Energy Corp Stock Monday?
Bonterra Energy Corp has seen a rise in its stock price this week, supported by operational updates indicating record production and strategic capital management decisions. However, profitability remains a concern as the company navigates its financial landscape.

Why Bonterra Energy Corp stock is sliding today
Bonterra Energy Corp's stock slid by 2.49% today, closing at CA$5.48. Despite recent production increases, the company's performance raises concerns about its immediate market outlook.

Why Bonterra Energy Corp stock is skyrocketing today
Bonterra Energy Corp's stock has experienced a significant increase, closing at CA$5.62, driven by investor optimism surrounding its operational strategies and production capabilities.

What's Going On With Bonterra Energy Corp Stock Tuesday?
Bonterra Energy Corp's stock has gained traction this week, with a 6.84% increase in a single day and a 7.25% rise over the week, driven by production updates and strategic initiatives. Investors should weigh the company's operational performance against its financial metrics as they consider the stock's outlook.

Why Bonterra Energy Corp stock is plummeting today
Bonterra Energy Corp's stock plummeted by 5.40% today, closing at CA$5.26. Investors are left questioning the company's resilience in a turbulent market, especially with no recent news to provide clarity.

Why Bonterra Energy Corp stock is sliding today
Bonterra Energy Corp's stock slid 3.06% today, closing at CA$5.39, raising questions about the company's current operational health and market position.
Why Bonterra Energy Corp stock is sliding today
Bonterra Energy Corp's stock slid by 2.97% today, closing at CA$5.55. This decline raises concerns about the company's operational stability and profitability amidst a backdrop of recent achievements.

Why Bonterra Energy Corp stock is rising today
Bonterra Energy Corp (BNE.TO) has experienced a significant rise in stock price today, driven by strong operational results and strategic initiatives that position the company for future growth.

Why Bonterra Energy Corp stock is rising today
Bonterra Energy Corp's stock surged by 2.48% in the last session, reflecting positive investor sentiment amid the company's operational updates and strategic initiatives.
Why Bonterra Energy Corp stock is sliding today
Bonterra Energy Corp's stock dropped significantly in the last trading session, raising questions about its future performance amidst a challenging energy market.

Why Bonterra Energy Corp stock is rising today
Bonterra Energy Corp's stock rose 2.25% in the latest trading session, closing at CA$5.45. This increase highlights the company's ongoing operational improvements and strategic capital management.

Why Bonterra Energy Corp stock is rising today
Bonterra Energy Corp's stock has seen a significant rise of 3.19%, driven by operational successes and strategic initiatives that aim to bolster shareholder value.

Why Bonterra Energy Corp stock is sliding today
Bonterra Energy Corp's stock slid 3.37% today, reflecting investor concerns over its financial performance. With a negative profit margin and no dividends, the outlook remains uncertain despite recent production achievements.

Why Bonterra Energy Corp stock is gaining today
Bonterra Energy Corp's stock gained 1.69% today, closing at CA$6.00. The company's strategic initiatives and operational strengths are key drivers behind this positive movement.

Why Bonterra Energy Corp stock is rising today
Bonterra Energy Corp's stock has seen a positive movement of 2.12% today, driven by operational successes and strategic initiatives. Investors are optimistic about the company's future prospects.

Why Bonterra Energy Corp stock is sliding today
Bonterra Energy Corp's stock has taken a hit, closing down 3.72% despite recent operational successes. Investors are left to ponder the implications of this downturn on the company's future.

Why Bonterra Energy Corp stock is sliding today
Bonterra Energy Corp's stock fell by 3.41% in the latest session, closing at CA$6.23. This decline raises questions about the company's financial stability, particularly given its negative profit margin and the absence of dividends.
