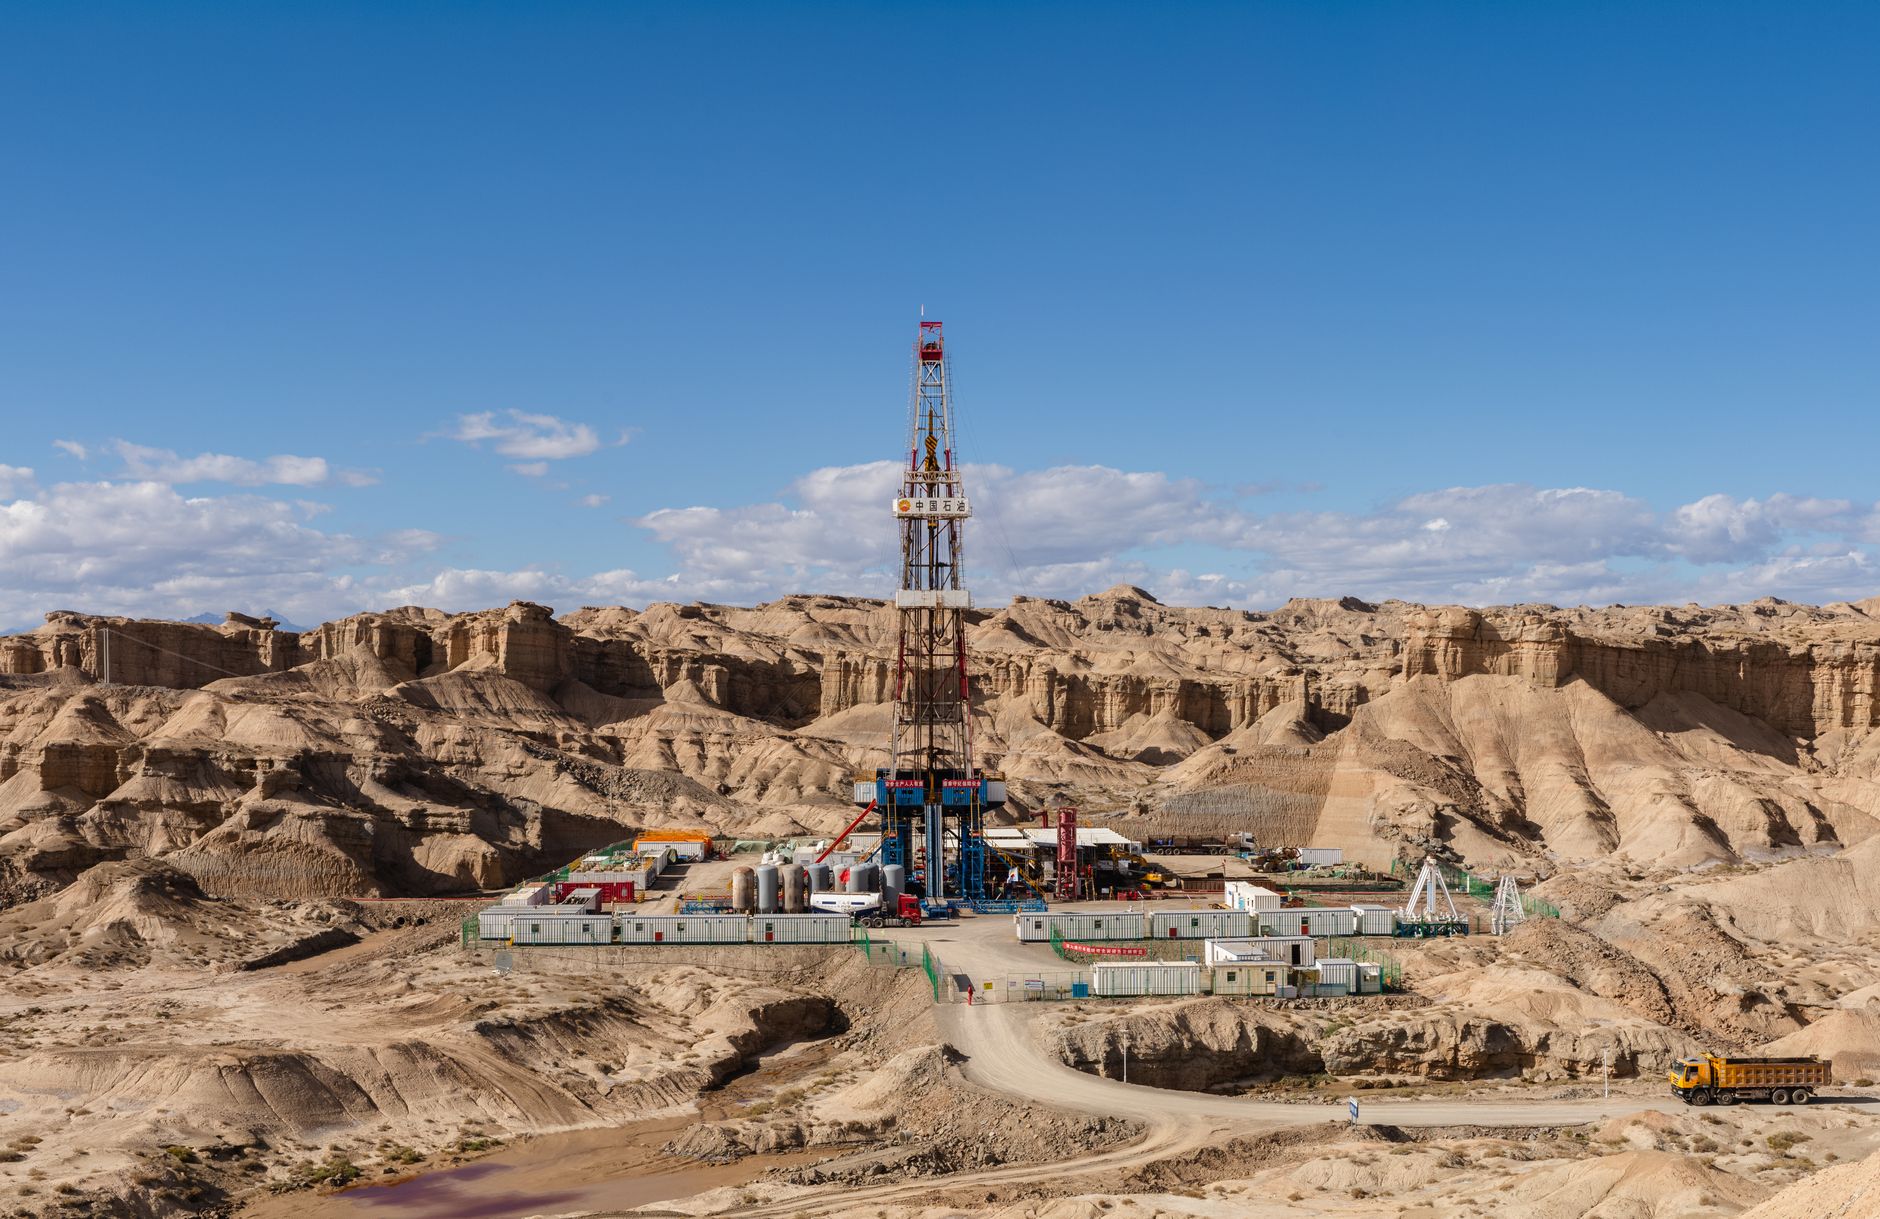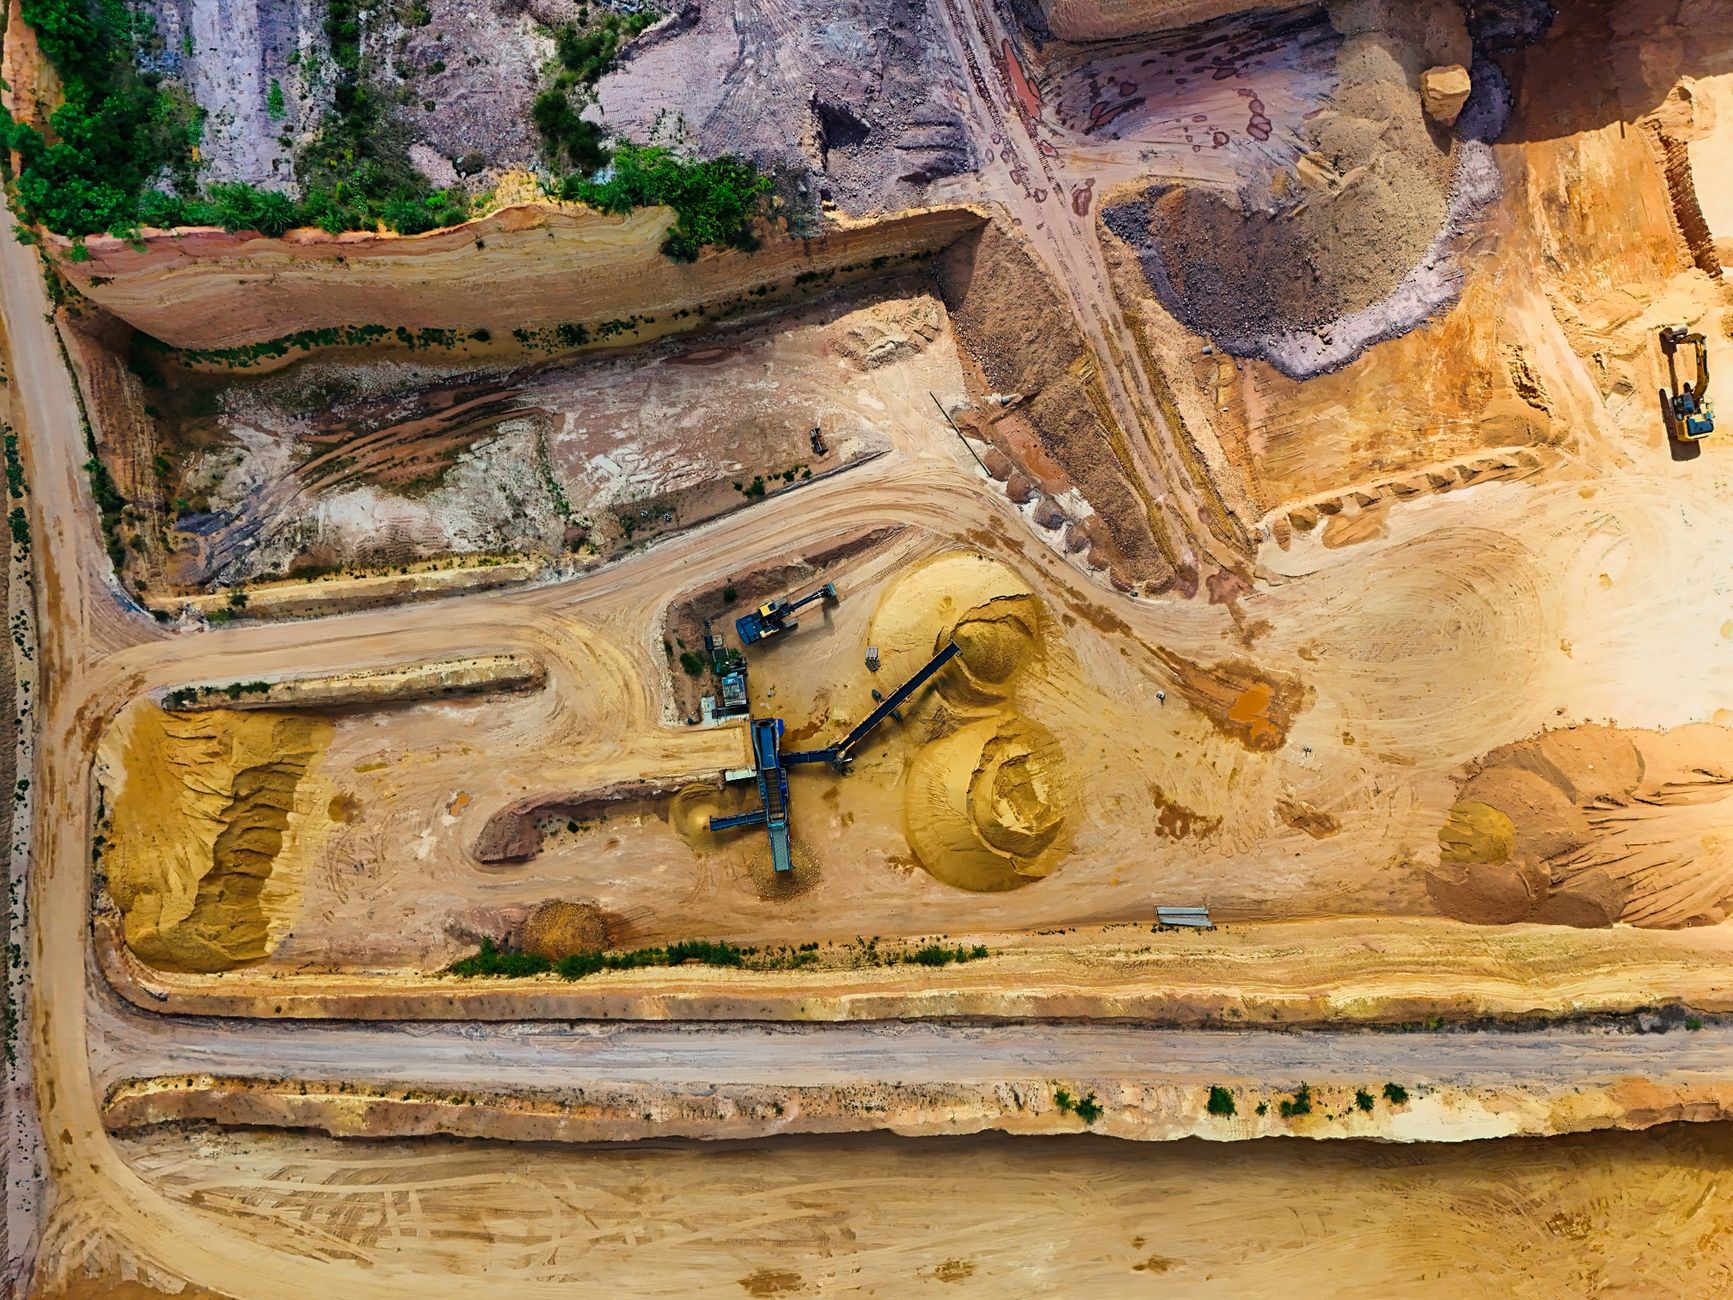
Canada is fast-tracking a 1 million-barrel-per-day oil pipeline to the Pacific to lessen its dependence on the U.S. market. This ambitious project could reshape Alberta's economy and create many jobs.
Prime Minister Mark Carney announced that Ottawa will prioritize the proposed oil pipeline from Alberta to British Columbia, which is expected to improve access to Asian buyers. The project could generate over C$20 billion in annual GDP and create up to 140,000 jobs during peak construction. With construction costs estimated between C$35.2 billion and C$43.7 billion, this initiative represents a major shift in Canada's energy strategy.
Advertisement
Pembina Pipeline Corp Pref A
PPL-PA.TO
PPL-PA.TO
Pembina Pipeline Corp Pref A
 WealthAwesome
Market cap
$39.73B
P/E
10.9x
Div. yield
11.56%
Div. / share
$2.88
52W high
$25.86
52W low
$22.45
Beta
0.70
Wealth Awesome Price Forecast
WA ModelStatistical 90-day price range based on PPL-PA's historical volatility
30-Day Vol
8.2%
Annualized
90-Day Vol
8.2%
Annualized
Trend (90d)
-6.3%
Annualized drift
90d Mean
C$24.51
Expected price
| Horizon | Expected | 68% Range (1σ) |
|---|---|---|
| 30 trading days | C$24.88 | C$24.19 – C$25.60 |
| 60 trading days | C$24.70 | C$23.73 – C$25.70 |
| 90 trading days | C$24.51 | C$23.34 – C$25.74 |
Methodology: Range is calculated using 30-day realized volatility via geometric Brownian motion (log-normal model). 68% band = ±1σ, 95% band = ±2σ. This is a statistical model, not a prediction. Past volatility does not guarantee future results. Not financial advice.
Advertisement
Investor takeaway: Long-term investors should keep an eye on how this pipeline affects Alberta's economy and the wider Canadian energy landscape.
A C$43.7 Billion Investment with Major Economic Implications
The estimated C$35.2 billion to C$43.7 billion construction cost signifies a substantial investment in Alberta's energy infrastructure, potentially transforming the province's economic future. Currently, over 90% of crude exports go to the U.S., but this pipeline could redirect a significant portion to Asia, especially as demand rises amid geopolitical tensions.
Bull case
Potential Economic Boost:
- The pipeline could generate over C$20 billion in annual GDP.
- It may create up to 140,000 jobs during peak construction.
- Alberta could see significant government revenue, estimated at C$100 billion by 2060.
- Increased access to Asian markets could diversify Canada's crude export base, reducing reliance on the U.S.
Bear case
Regulatory and Community Challenges:
- The project still needs final route approval and regulatory processes.
- Consultation with Indigenous communities could complicate timelines.
- Environmental concerns might lead to opposition, delaying construction.
- The existing Trans Mountain pipeline is already at capacity, raising questions about infrastructure limits.
The Economic Impact of the Pipeline
Advertisement
The proposed pipeline is expected to significantly boost Alberta's economy. With estimates suggesting it could generate over C$20 billion in annual GDP, the project promises to create up to 140,000 jobs at its peak. This economic activity could also lead to substantial government revenue, projected to reach C$100 billion by 2060.
Challenges Ahead for the New Pipeline
Despite its potential benefits, the pipeline faces several hurdles. Regulatory approvals, final route determinations, and consultations with Indigenous communities are crucial steps that could delay the project. Environmental concerns may also spark opposition, complicating the construction timeline.
Shifting Focus to Asian Markets
With Canada currently sending over 90% of its crude exports to the U.S., this new pipeline aims to diversify its market reach. Given the recent geopolitical tensions affecting oil flows from the Middle East, access to Asian markets has become increasingly valuable. The pipeline could help Canada meet the growing demand from countries like China, which has already become a major buyer of Canadian oil.
Best next step
Keep exploring this topic
If you want to go deeper, these are the most useful follow-up pages and tools for this topic.
Broker comparison
Best trading platforms in Canada
Compare $0-commission brokers before you act on a ticker story.
Safe cash
Best GIC rates in Canada
If the story makes you want to de-risk, compare guaranteed rates next.
HISA roundup
Best high-interest savings accounts
Keep dry powder in a no-fee savings account instead of chequing.
TFSA room
Check TFSA contribution room
Shelter the next contribution before you buy.
Advertisement

Wealth Awesome
Timely coverage of Canadian stocks, earnings, dividends, and market movers for DIY investors. Stories are checked against exchange data and public filings.
View Full Profile →✅ Reviewed by Certified Financial Professionals
This content has been reviewed by CFA® charterholders and Certified Financial Planners (CFP®) with over a decade of experience in Canadian financial markets. All information is fact-checked against official Canadian sources and regulations.
Why these credentials matter: CFA® charterholders complete 900+ hours of rigorous study in investment analysis and ethics. CFP® professionals are held to the highest standards of financial planning competency and fiduciary duty in Canada.
⚠️ Professional Disclaimer
This content is for educational purposes only and should not be considered personalized financial advice. While our team brings professional expertise, individual circumstances vary. For personalized guidance, consult with a qualified financial advisor, tax professional, or mortgage specialist.