Clarke Inc. (CKI : TSX)
Common Stock
$23.14
CAD
+0.14 (0.61%)
Last updated: 2026-07-20
CKI
Clarke Inc.
Performance
1 Day
+0.61%
1 Week
-1.41%
1 Month
+2.16%
YTD
+10.77%
Key Statistics
Market Cap
$298.27M
52W High
$36.50
52W Low
$18.76
P/E Ratio
10.50
50 Day MA
$24.50
200 Day MA
$23.44
Beta
0.13
Dividend Yield
-
Technical Indicators
Price vs 50-Day SMA
Price vs 200-Day SMA
Recent Price History
| Date | Open | High | Low | Close | Adj Close | Volume |
|---|---|---|---|---|---|---|
| 7/20/2026 | $23.49 | $23.49 | $23.00 | $23.14 | $23.14 | 3,313 |
| 7/17/2026 | $23.15 | $23.25 | $23.00 | $23.00 | $23.00 | 4,926 |
| 7/16/2026 | $23.30 | $23.30 | $23.10 | $23.16 | $23.16 | 3,221 |
| 7/15/2026 | $23.50 | $23.52 | $23.28 | $23.52 | $23.52 | 1,000 |
| 7/14/2026 | $23.37 | $23.69 | $23.04 | $23.15 | $23.15 | 4,605 |
| 7/13/2026 | $23.50 | $23.60 | $23.00 | $23.47 | $23.47 | 1,201 |
| 7/10/2026 | $23.60 | $23.61 | $22.86 | $23.40 | $23.40 | 5,292 |
| 7/9/2026 | $23.20 | $23.60 | $23.18 | $23.40 | $23.40 | 5,058 |
| 7/8/2026 | $23.00 | $23.10 | $23.00 | $23.10 | $23.10 | 3,902 |
| 7/7/2026 | $23.24 | $23.24 | $22.85 | $23.00 | $23.00 | 5,695 |
Wealth Awesome Price Forecast
WA ModelStatistical 90-day price range based on CKI's historical volatility
30-Day Vol
26.2%
Annualized
90-Day Vol
41.7%
Annualized
Trend (90d)
-46.8%
Annualized drift
90d Mean
C$19.58
Expected price
| Horizon | Expected | 68% Range (1σ) |
|---|---|---|
| 30 trading days | C$21.89 | C$19.99 – C$23.96 |
| 60 trading days | C$20.70 | C$18.21 – C$23.52 |
| 90 trading days | C$19.58 | C$16.74 – C$22.89 |
Methodology: Range is calculated using 30-day realized volatility via geometric Brownian motion (log-normal model). 68% band = ±1σ, 95% band = ±2σ. This is a statistical model, not a prediction. Past volatility does not guarantee future results. Not financial advice.
About Clarke Inc.
Clarke Inc. is a real estate investment firm specializing in primarily residential, furnished suites and hospitality. Clarke Inc. was founded in 1997 and is headquartered in Halifax, Nova Scotia, Canada.
Financials
- Revenue (TTM)
- $82.42M
- EBITDA
- $29.95M
- Profit Margin
- 35.82%
- ROE (TTM)
- 10.46%
- EPS (Diluted)
- 2.19
- Book Value
- 22.01
Classification
- Sector
- Consumer Discretionary
- Industry
- Hotels, Restaurants & Leisure
- Group
- Consumer Services
Advertisement
7 stocks to buy and hold forever
Blue-chip dividend stocks for long-term wealth building.
Get the FREE ReportExplore More
Common Questions About CKI
Articles Featuring CKI.TO
Latest articles and analysis covering CKI.TO
Why Clarke Inc. stock is tanking today
Clarke Inc. is seeing a decline in its stock price, down 1.47% today, as investors react to its recent financial results showing a significant drop in net income.

What's Going On With Clarke Inc. Stock Monday?
Clarke Inc. has faced a challenging year, with its stock reflecting a decline amid mixed financial results. Recent announcements reveal fluctuations in net income and increased interest expenses, prompting a cautious outlook for investors.

Why Clarke Inc. stock is tanking today
Clarke Inc. stock is down 1.83% today, reflecting investor concerns following a significant drop in net income reported for 2025. As the company navigates increased interest expenses and lower fair value adjustments, stakeholders are left questioning its future performance.

What's Going On With Clarke Inc. Stock Tuesday?
Clarke Inc. has seen a positive stock performance recently, but its financial results show a decline in net income, prompting mixed feelings among investors. The company's strategic moves, including acquisitions, may influence future performance.
Why Clarke Inc. stock is rising today
Clarke Inc. (CKI.TO) has seen its stock price increase by 2.45% in the latest trading session, closing at CA$23.00. This rise comes as the company navigates through recent financial challenges, with investors showing optimism in its recovery trajectory.
Why Clarke Inc. stock is sliding today
Clarke Inc. saw its stock slide by 2.71% today, closing at CA$22.25. Investors are left questioning the sustainability of its recent financial performance amidst a challenging market environment.

Why Clarke Inc. stock is gaining today
Clarke Inc.'s stock gained 1.87% in the latest trading session, closing at CA$22.87. This rise highlights investor optimism despite recent financial challenges.

Why Clarke Inc. stock is gaining today
Clarke Inc. (CKI.TO) has shown a positive gain of 1.08% today, reflecting investor confidence amid strategic moves to enhance shareholder value.

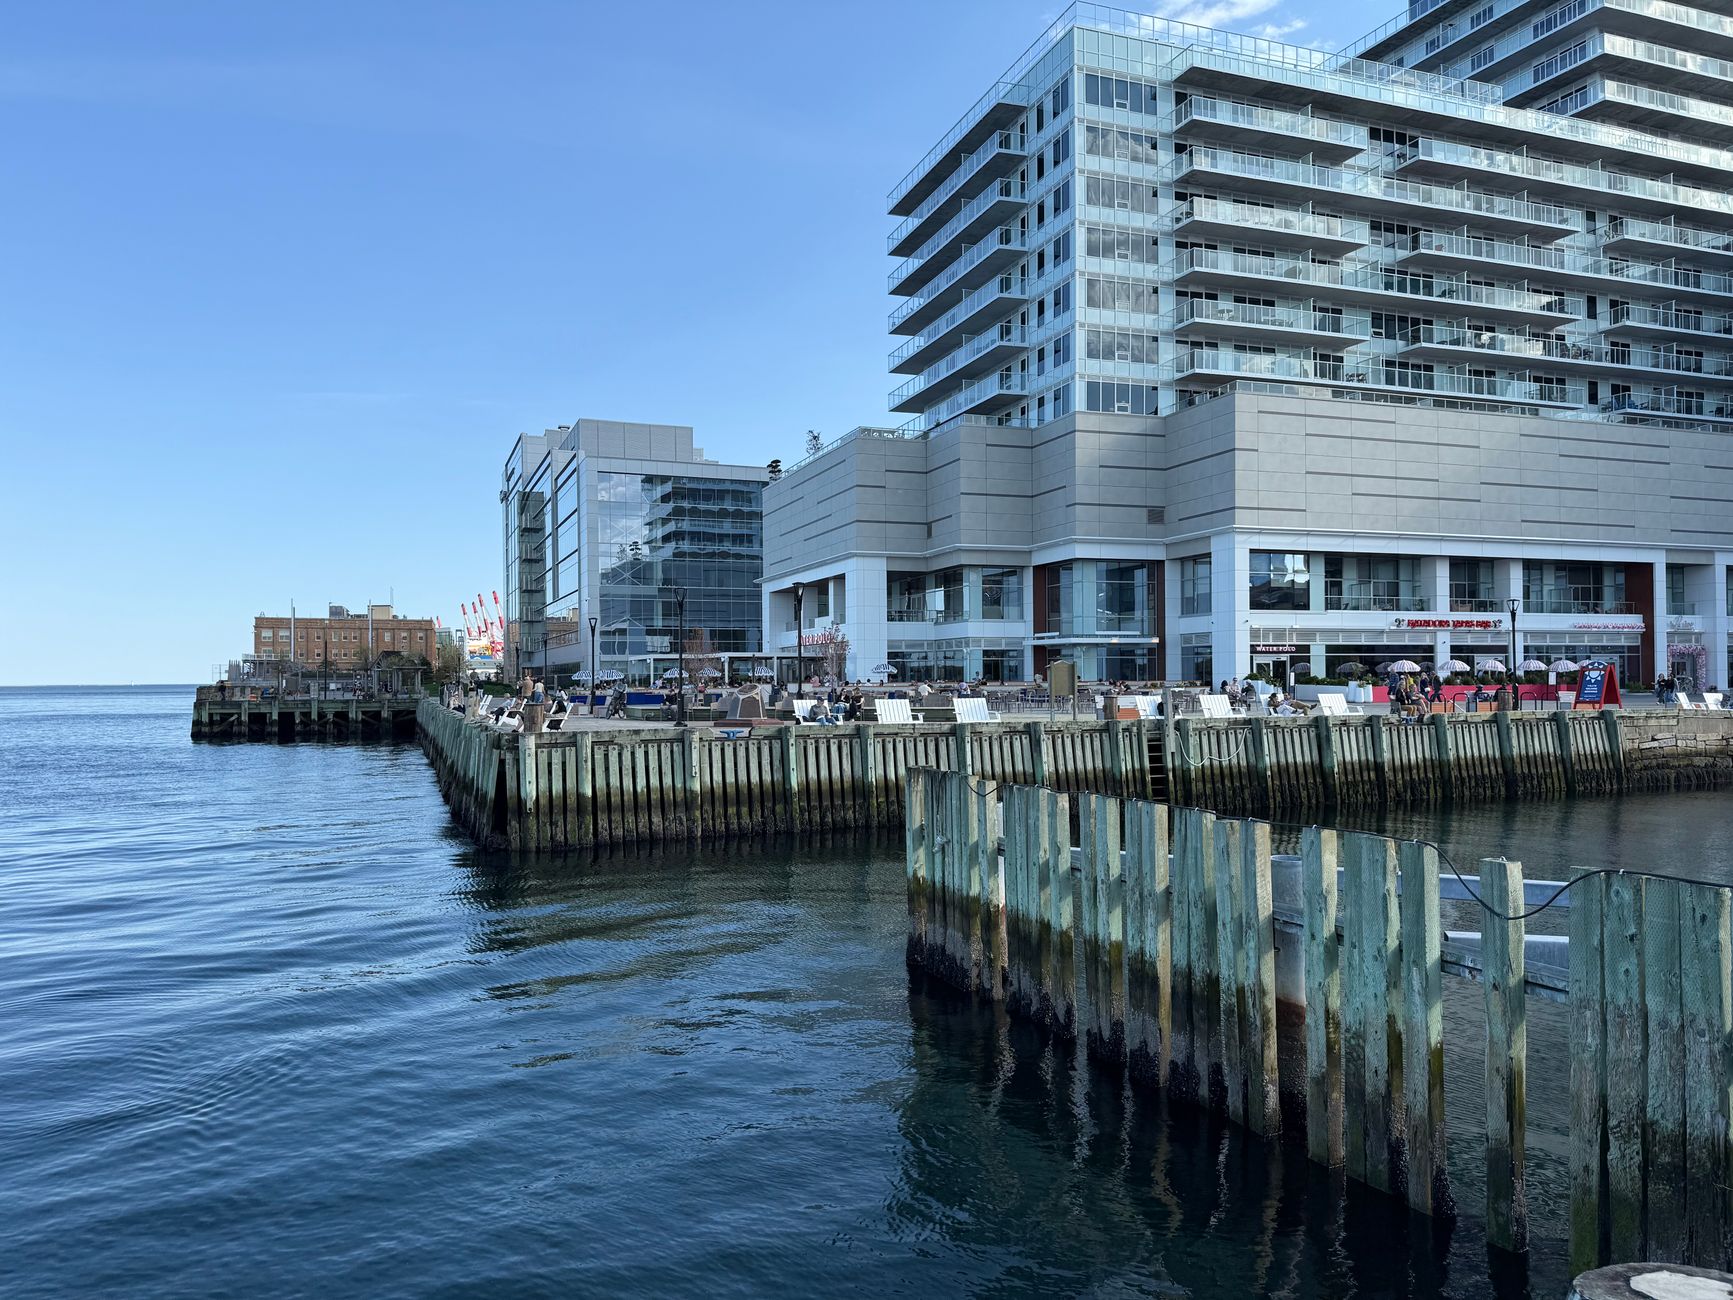
7 Best Canadian Tourism Stocks (Jul 2026): Invest In Leisure
Tourism spending in Canada was at about $15.7 billion in the first quarter of 2022, and only about 14% came from non-residents. This broadens the asset pool of Canadian tourism stocks as we can also target businesses that cater to domestic tourists. There is a lot of diversity within this industry,
![7 Best Canadian Tourism Stocks ([currentmonthyear]): Invest In Leisure](https://lhajohzwizrsjmumhpjg.supabase.co/storage/v1/object/public/wealth-awesome/site-media/best-canadian-tourism-stocks_23.jpg)