
Why Constellation Software Shares Rose 17% This Week
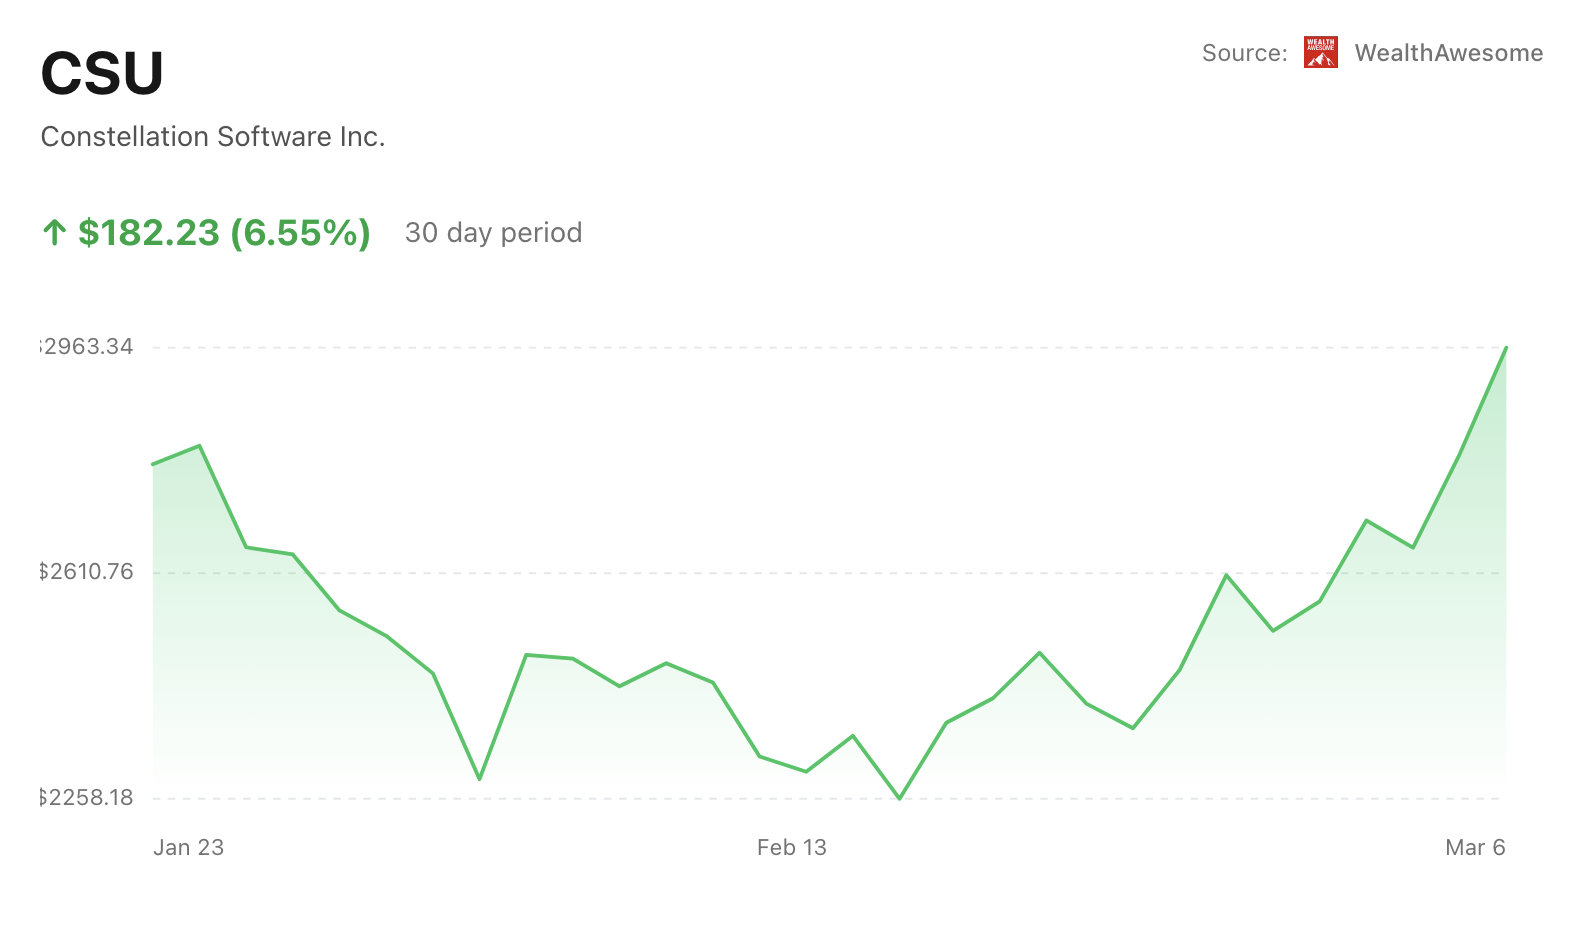
Shares of Constellation Software Inc. surged this week, climbing to about $2,963 on the TSX and pushing the Canadian software giant up more than 17% over the past five trading days.
Advertisement
Constellation Software Inc.
CSU.TO
CSU.TO
Constellation Software Inc.
 WealthAwesome
Market cap
$59.03B
P/E
43.9x
Div. yield
0.14%
Div. / share
$4.00
52W high
$4101.76
52W low
$2192.51
1W change
+0.62%
Beta
0.70
Analyst Price Targets
Based on analyst covering CSU · as of Sep 24, 2026
Wall Street analysts forecast CSU stock price to rise 41.0% over the next 12 months.
Consensus
BullishBased on avg. target vs last close (formal rating unavailable for Canadian listings)
Avg. Target
C$4013.72
+41.0% Upside
Previously C$3991.77 on Sep 23, 2026
Current Price
C$2846.12
Last close
Targets are snapshotted when they change. Unchanged figures keep their original date. Not financial advice.
Wealth Awesome Price Forecast
WA ModelStatistical 90-day price range based on CSU's historical volatility
30-Day Vol
34.9%
Annualized
90-Day Vol
45.9%
Annualized
Trend (90d)
+12.0%
Annualized drift
90d Mean
C$2970.93
Expected price
| Horizon | Expected | 68% Range (1σ) |
|---|---|---|
| 30 trading days | C$2887.13 | C$2559.52 – C$3256.67 |
| 60 trading days | C$2928.73 | C$2470.05 – C$3472.59 |
| 90 trading days | C$2970.93 | C$2411.53 – C$3660.09 |
Methodology: Range is calculated using 30-day realized volatility via geometric Brownian motion (log-normal model). 68% band = ±1σ, 95% band = ±2σ. This is a statistical model, not a prediction. Past volatility does not guarantee future results. Not financial advice.
Advertisement
WHAT JUST HAPPENED
• Constellation Software (TSX: CSU) closed at $2,963.34 on March 6, rising 5.95% in a single session.
• Over the past five trading days, the stock has gained 17.56%, one of the strongest weekly moves among large-cap TSX technology companies.
• The company’s market capitalization now sits near $62.8 billion, placing it among Canada’s largest technology firms.
• The rally comes ahead of the company’s March earnings window and follows a governance agreement tied to travel-technology company Sabre.
WHY THE MARKET CARES
Constellation Software has built a reputation in Canadian markets as a disciplined acquirer of niche software businesses. The company focuses on “vertical market software” — specialized systems used by industries such as healthcare, utilities, and government agencies.
These products tend to be deeply embedded in operations and difficult for customers to replace. As a result, many of Constellation’s subsidiaries generate steady recurring revenue.
Over the years, that strategy has expanded the company into a network of more than 1,000 operating businesses worldwide, helping drive strong returns on invested capital.
The latest move appears connected to a new development involving Sabre Corporation, a major travel-technology provider. Earlier this month, Sabre announced a governance agreement with Constellation after the Canadian company built a significant ownership stake. Under the arrangement, a senior executive from Constellation’s Vela Software group will join Sabre’s board.
Investors often watch these types of strategic stakes closely because they can signal future partnerships, capital deployment, or potential acquisition activity.
The rally also follows a weak start to the year. Even after this week’s surge, the stock is still down roughly 8.5% year-to-date, suggesting part of the move may reflect investors repositioning after earlier selling pressure.
Advertisement
THE KEY NUMBER
17.56%
That’s Constellation Software’s gain over the past week — a significant move for a company valued at more than $60 billion.
WHAT HAPPENS NEXT
Attention now turns to the company’s upcoming earnings cycle in March. Analysts expect revenue to continue expanding as Constellation adds new software businesses and grows its existing portfolio. Current estimates point to annual revenue above $11 billion.
Investors will also be watching acquisition activity. Constellation’s long-term growth has depended on continuously buying smaller software firms and reinvesting their cash flows into additional deals.
Valuation remains part of the debate. The stock trades at a price-to-earnings ratio above 60, high even by software-sector standards. If growth expectations soften or interest rates remain elevated, some investors may reassess that premium.
BOTTOM LINE
Constellation Software’s sharp rally highlights renewed investor interest in profitable software companies with durable recurring revenue.
While the stock is still below its earlier highs this year, the past week shows how quickly sentiment can shift around one of Canada’s most closely followed technology companies.
Best next step
Keep exploring this topic
If you want to go deeper, these are the most useful follow-up pages and tools for this topic.
Broker comparison
Best trading platforms in Canada
Compare $0-commission brokers before you act on a ticker story.
Safe cash
Best GIC rates in Canada
If the story makes you want to de-risk, compare guaranteed rates next.
HISA roundup
Best high-interest savings accounts
Keep dry powder in a no-fee savings account instead of chequing.
TFSA room
Check TFSA contribution room
Shelter the next contribution before you buy.
Advertisement

Qayyum Rajan, CFA
Qayyum is the CEO of Wealth Awesome, a leading Canadian personal finance publication. As a CFA charterholder with extensive experience in fintech, data science, and quantitative finance, he brings a unique analytical perspective to investing and wealth management.
View Full Profile →✅ Reviewed by Certified Financial Professionals
This content has been reviewed by CFA® charterholders and Certified Financial Planners (CFP®) with over a decade of experience in Canadian financial markets. All information is fact-checked against official Canadian sources and regulations.
Why these credentials matter: CFA® charterholders complete 900+ hours of rigorous study in investment analysis and ethics. CFP® professionals are held to the highest standards of financial planning competency and fiduciary duty in Canada.
⚠️ Professional Disclaimer
This content is for educational purposes only and should not be considered personalized financial advice. While our team brings professional expertise, individual circumstances vary. For personalized guidance, consult with a qualified financial advisor, tax professional, or mortgage specialist.