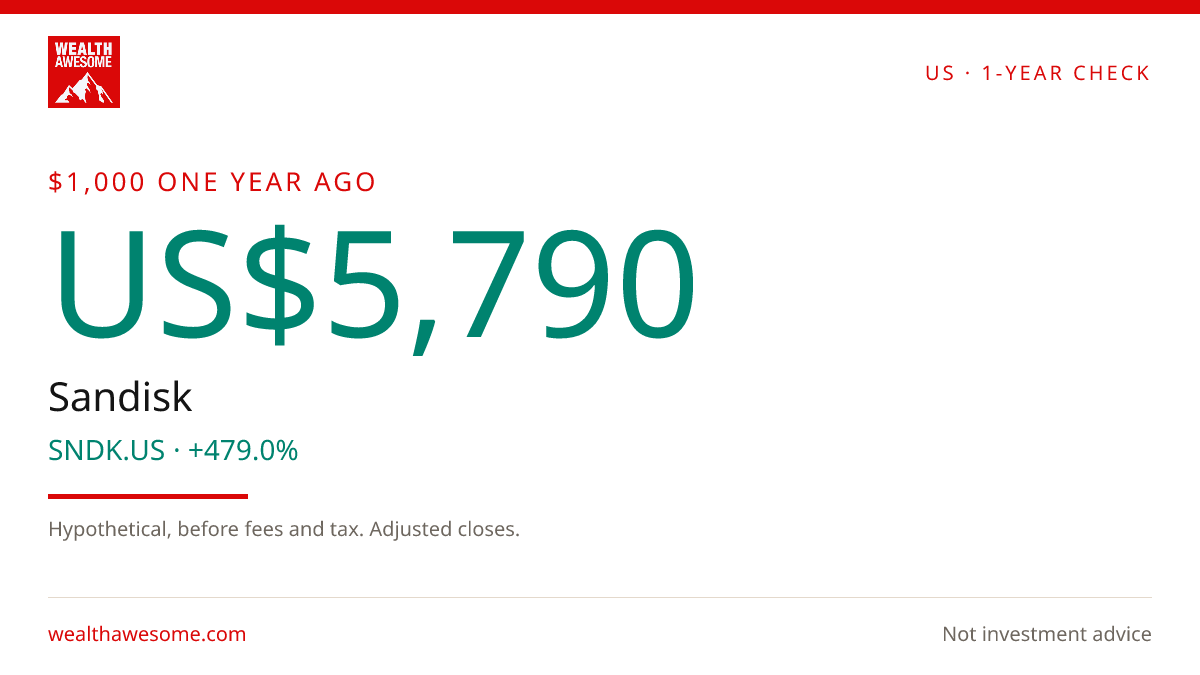
US$1,000 invested in Sandisk on November 4, 2025, would have grown to US$5,790 by November 3, 2026, based on the adjusted closing prices provided.
Sandisk Corp shares rose from an adjusted close of US$194.57 on November 4, 2025, to US$1,126.52 on November 3, 2026. That’s a hypothetical return of 479.0% over one year, before fees and tax. The adjusted prices include dividends, and no other amounts are added. This calculation assumes you invested a lump sum and held it for the full period.
Investor takeaway: Sandisk posted a sharp one-year gain in this snapshot. On the stated assumptions, US$1,000 grew to US$5,790. That’s a record of past performance, not a forecast. Your actual return could differ because of timing, fees, taxes, or other factors.
Sandisk Corp
SNDK.US
SNDK.US
Sandisk Corp
 WealthAwesome
Market cap
$160.29B
P/E
9.0x
52W high
$2354.39
52W low
$183.00
1W change
-13.67%
Analyst Price Targets
Based on 25 analysts covering SNDK · as of Nov 4, 2026
Wall Street analysts forecast SNDK stock price to rise 7304.4% over the next 12 months.
Consensus
Buy4.48 / 5.00
Avg. Target
C$2023.63
+7304.4% Upside
Previously C$2105.29 on Nov 2, 2026
Current Price
C$27.33
Last close
Analyst Breakdown (25 analysts)
Targets are snapshotted when they change. Unchanged figures keep their original date. Not financial advice.
Wealth Awesome Price Forecast
WA ModelStatistical 90-day price range based on SNDK's historical volatility
30-Day Vol
73.8%
Annualized
90-Day Vol
109.9%
Annualized
Trend (90d)
-39.6%
Annualized drift
90d Mean
C$977.93
Expected price
| Horizon | Expected | 68% Range (1σ) |
|---|---|---|
| 30 trading days | C$1074.64 | C$833.04 – C$1386.31 |
| 60 trading days | C$1025.14 | C$715.12 – C$1469.58 |
| 90 trading days | C$977.93 | C$629.14 – C$1520.09 |
Methodology: Range is calculated using 30-day realized volatility via geometric Brownian motion (log-normal model). 68% band = ±1σ, 95% band = ±2σ. This is a statistical model, not a prediction. Past volatility does not guarantee future results. Not financial advice.
US$1,000 became US$5,790
From November 4, 2025, to November 3, 2026, Sandisk’s adjusted close rose from US$194.57 to US$1,126.52. That works out to a hypothetical total return of 479.0%, before fees and tax.
Bull case
Sandisk’s adjusted close rose substantially over the year. That past performance may be useful context as you research the company, but it doesn’t guarantee further gains.
Bear case
A large past gain can also prompt questions about volatility and changing expectations. The one-year return alone can’t tell you whether the shares are right for your situation.
What the one-year calculation showed
The supplied snapshot lists Sandisk’s adjusted close at US$194.57 on November 4, 2025, and US$1,126.52 on November 3, 2026. If you had invested US$1,000 at the start and held the shares, your investment would have been worth US$5,790 at the end. The reported total return was 479.0% over 1.00 years of bars. The annualized return was 482.5%, another way to express performance over the stated period. Both figures are hypothetical and based on adjusted closes, before fees and tax. Dividends are included in the adjusted series, and no other amounts are added. For more company information, see our Sandisk stock page.
Putting the result in context
The calculation uses only the supplied start and end adjusted closes for SNDK.US. It assumes no additional contributions or withdrawals and doesn’t account for your personal costs or tax situation. The snapshot also lists Sandisk’s latest market capitalization as US$160.3B and its trailing P/E as 9.0. The P/E is a current valuation measure and wasn’t used to calculate the return. These figures provide context, but they don’t explain the share-price move. For more company details, visit the Sandisk company profile.
A historical result, not a forecast
Sandisk’s adjusted close ended the measured period well above its starting level, resulting in a large hypothetical gain under the stated assumptions. But one year of data doesn’t capture every risk or predict what will happen in another period. These figures cover only the supplied dates and prices. Read them as a record of what the investment would have been worth under those assumptions.
Best next step
Keep exploring this topic
If you want to go deeper, these are the most useful follow-up pages and tools for this topic.
Broker comparison
Best trading platforms in Canada
Compare $0-commission brokers before you act on a ticker story.
Safe cash
Best GIC rates in Canada
If the story makes you want to de-risk, compare guaranteed rates next.
HISA roundup
Best high-interest savings accounts
Keep dry powder in a no-fee savings account instead of chequing.
TFSA room
Check TFSA contribution room
Shelter the next contribution before you buy.

Wealth Awesome
Timely coverage of Canadian stocks, earnings, dividends, and market movers for DIY investors. Stories are checked against exchange data and public filings.
View Full Profile →✅ Reviewed by Certified Financial Professionals
This content has been reviewed by CFA® charterholders and Certified Financial Planners (CFP®) with over a decade of experience in Canadian financial markets. All information is fact-checked against official Canadian sources and regulations.
Why these credentials matter: CFA® charterholders complete 900+ hours of rigorous study in investment analysis and ethics. CFP® professionals are held to the highest standards of financial planning competency and fiduciary duty in Canada.
⚠️ Professional Disclaimer
This content is for educational purposes only and should not be considered personalized financial advice. While our team brings professional expertise, individual circumstances vary. For personalized guidance, consult with a qualified financial advisor, tax professional, or mortgage specialist.