
Magna International Shares Near 52-Week High After 27% Weekly Surge With No New Catalyst
Magna International Inc. shares are extending a powerful five-day rally, up 26.7% this week and trading within 2% of their 52-week high — despite no new earnings release, contract win, or corporate update.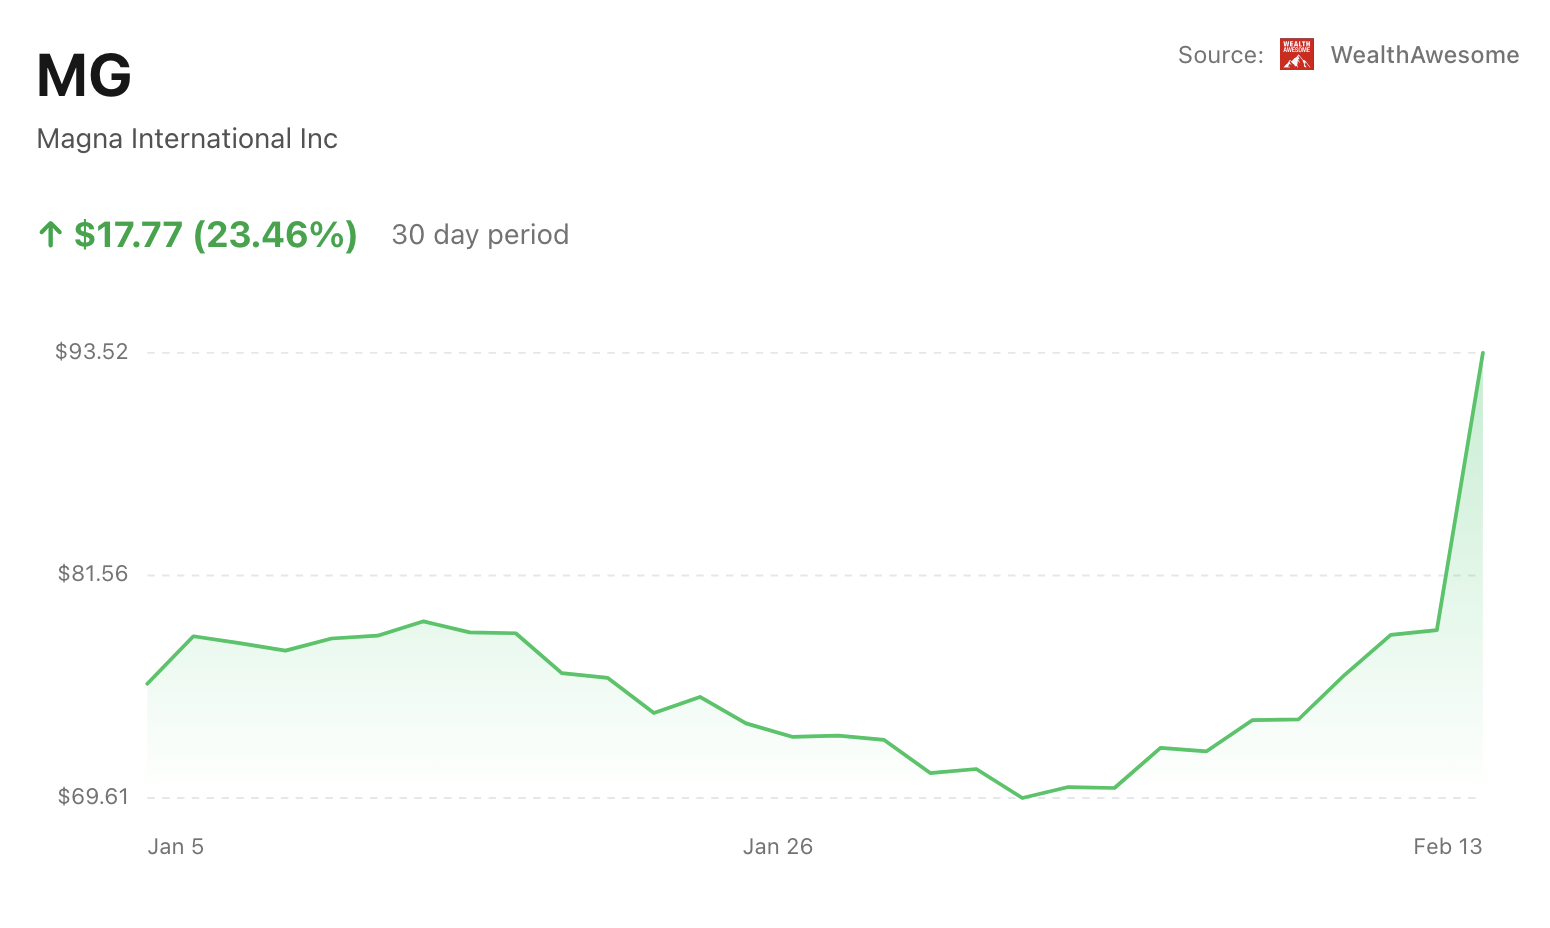
What Just Happened
• Magna International (TSX: MG) closed at $93.52 on February 13, gaining 18.9% in a single session.
• The stock is now up 26.72% over the past week and 24.66% year-to-date.
• Shares briefly hit $95.18 intraday, matching their 52-week high.
• Volume surged to 3.69 million shares, more than double the prior session.
Advertisement

Get up to $2,000 cash back
Open and fund a new Qtrade account with promo code SPRING26. Offer ends July 31, 2026.
Magna International Inc
MG.TO
MG.TO
Magna International Inc
 WealthAwesome
Market cap
$24.78B
P/E
27.1x
52W high
$96.00
52W low
$54.04
1W change
-2.84%
Beta
1.86
Analyst Price Targets
Based on analyst covering MG
Wall Street analysts forecast MG stock price to rise 2.2% over the next 12 months.
Consensus
NeutralBased on avg. target vs last close (formal rating unavailable for Canadian listings)
Avg. Target
C$92.57
+2.2% Upside
Current Price
C$90.62
Last close
Analyst ratings and price targets are updated periodically. Not financial advice.
Wealth Awesome Price Forecast
WA ModelStatistical 90-day price range based on MG's historical volatility
30-Day Vol
32.4%
Annualized
90-Day Vol
35.3%
Annualized
Trend (90d)
+50.0%
Annualized drift
90d Mean
C$108.34
Expected price
| Horizon | Expected | 68% Range (1σ) |
|---|---|---|
| 30 trading days | C$96.18 | C$86.01 – C$107.54 |
| 60 trading days | C$102.08 | C$87.16 – C$119.54 |
| 90 trading days | C$108.34 | C$89.28 – C$131.46 |
Methodology: Range is calculated using 30-day realized volatility via geometric Brownian motion (log-normal model). 68% band = ±1σ, 95% band = ±2σ. This is a statistical model, not a prediction. Past volatility does not guarantee future results. Not financial advice.
The move comes without a headline catalyst.
What’s Driving the Rally
A near-27% weekly gain in a large-cap TSX name rarely happens quietly. In Magna’s case, the move appears technical and positioning-driven rather than news-driven.
The stock has decisively cleared both its 50-day moving average ($73.69) and 200-day moving average ($62.88), a breakout that often attracts momentum funds and algorithmic buying. The speed of the advance has pushed momentum indicators into overbought territory.
Short interest sits at roughly 1.8% of float, making a squeeze unlikely. This looks more like capital rotation into cyclical and industrial names that had lagged earlier in the year.
Valuation may also be part of the story. At 23.5 times earnings and 0.5 times sales, Magna trades at a discount to several U.S. auto parts peers. With forward EPS growth projected at 12.5% next year and some recent upward estimate revisions, investors may be positioning ahead of the next earnings cycle.
The Key Number
+26.72%
That one-week gain puts Magna among the strongest TSX performers over the past five sessions and within striking distance of a technical breakout.
What Matters Now
The stock is now trading roughly 19% above the average analyst target of $75.58. That gap raises the stakes for the next earnings report, expected in early May.
If results validate improving margins or stronger order visibility, the stock could sustain a move above its 52-week high and force analysts to lift targets. If not, the absence of a fundamental catalyst may invite profit-taking after such a rapid run.
Bottom Line
Magna’s surge has reshaped its technical profile in less than a week. With shares pressing against resistance and trading well above consensus targets, the next earnings update will determine whether this rally marks a durable re-rating — or a short-term momentum spike.
Advertisement