Precision Drilling Corporation (PD : TSX)
Common Stock
$116.00
CAD
-1.21 (-1.03%)
Last updated: 2026-07-20
PD
Precision Drilling Corporation
Performance
1 Day
-1.03%
1 Week
-1.84%
1 Month
-2.65%
YTD
+14.79%
Key Statistics
Market Cap
$1.52B
52W High
$143.81
52W Low
$67.49
P/E Ratio
-
50 Day MA
$122.62
200 Day MA
$109.83
Beta
1.27
Dividend Yield
-
Technical Indicators
Price vs 50-Day SMA
Price vs 200-Day SMA
Recent Price History
| Date | Open | High | Low | Close | Adj Close | Volume |
|---|---|---|---|---|---|---|
| 7/20/2026 | $116.27 | $117.53 | $115.59 | $116.00 | $116.00 | 45,426 |
| 7/17/2026 | $117.00 | $117.30 | $113.89 | $117.21 | $117.21 | 45,699 |
| 7/16/2026 | $114.95 | $116.85 | $114.36 | $115.14 | $115.14 | 46,807 |
| 7/15/2026 | $116.38 | $117.23 | $112.18 | $115.02 | $115.02 | 89,941 |
| 7/14/2026 | $118.00 | $119.93 | $115.12 | $116.31 | $116.31 | 91,971 |
| 7/13/2026 | $116.11 | $119.24 | $116.11 | $118.17 | $118.17 | 85,739 |
| 7/10/2026 | $114.45 | $115.24 | $112.55 | $113.70 | $113.70 | 64,795 |
| 7/9/2026 | $115.06 | $115.06 | $112.57 | $114.38 | $114.38 | 65,889 |
| 7/8/2026 | $112.58 | $115.65 | $112.58 | $115.29 | $115.29 | 111,279 |
| 7/7/2026 | $107.84 | $112.24 | $107.84 | $111.37 | $111.37 | 69,491 |
Analyst Price Targets
Based on analyst covering PD
Wall Street analysts forecast PD stock price to rise 29.2% over the next 12 months.
Consensus
BullishBased on avg. target vs last close (formal rating unavailable for Canadian listings)
Avg. Target
C$149.89
+29.2% Upside
Current Price
C$116.00
Last close
Analyst ratings and price targets are updated periodically. Not financial advice.
Wealth Awesome Price Forecast
WA ModelStatistical 90-day price range based on PD's historical volatility
30-Day Vol
42.0%
Annualized
90-Day Vol
44.6%
Annualized
Trend (90d)
-34.4%
Annualized drift
90d Mean
C$102.60
Expected price
| Horizon | Expected | 68% Range (1σ) |
|---|---|---|
| 30 trading days | C$111.35 | C$96.34 – C$128.70 |
| 60 trading days | C$106.89 | C$87.10 – C$131.17 |
| 90 trading days | C$102.60 | C$79.85 – C$131.84 |
Methodology: Range is calculated using 30-day realized volatility via geometric Brownian motion (log-normal model). 68% band = ±1σ, 95% band = ±2σ. This is a statistical model, not a prediction. Past volatility does not guarantee future results. Not financial advice.
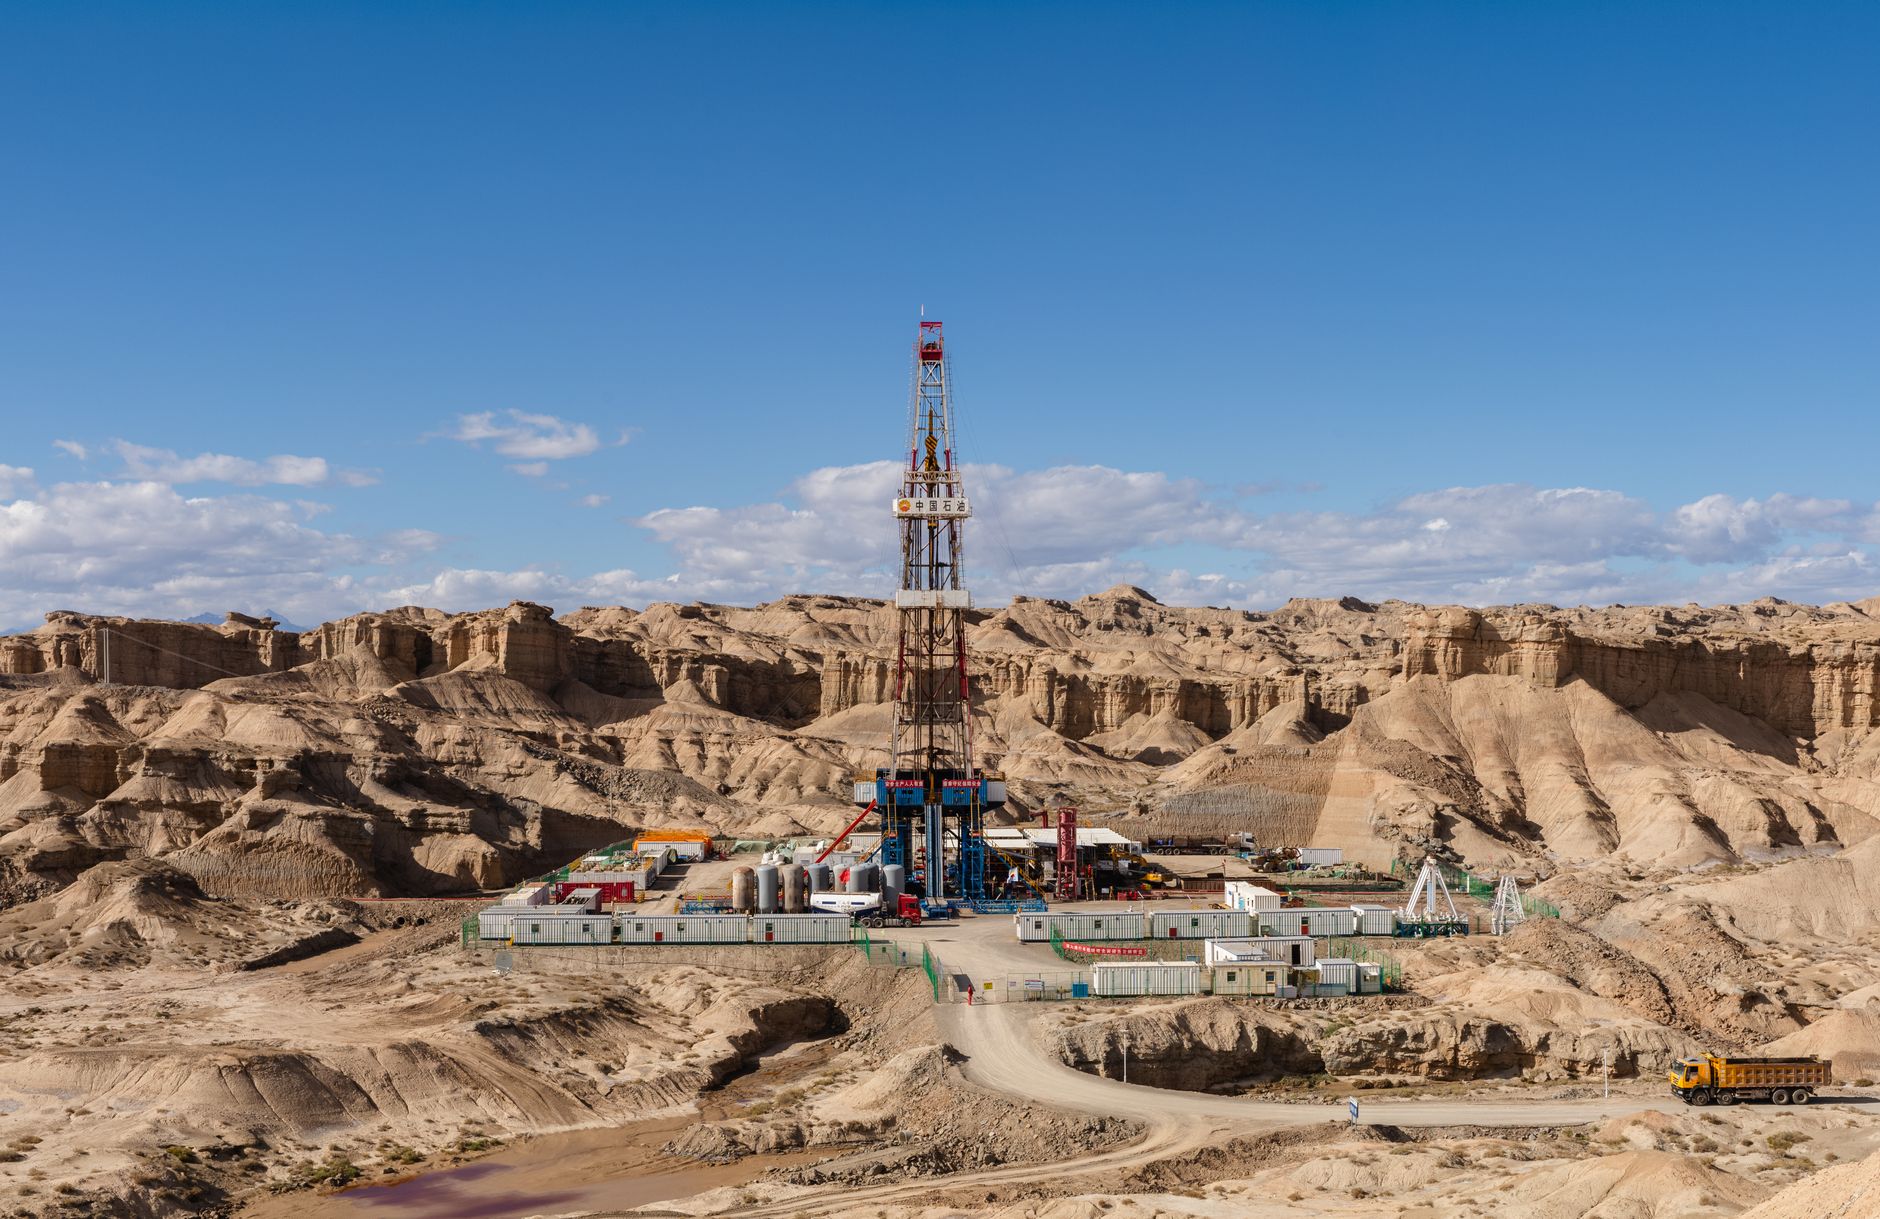
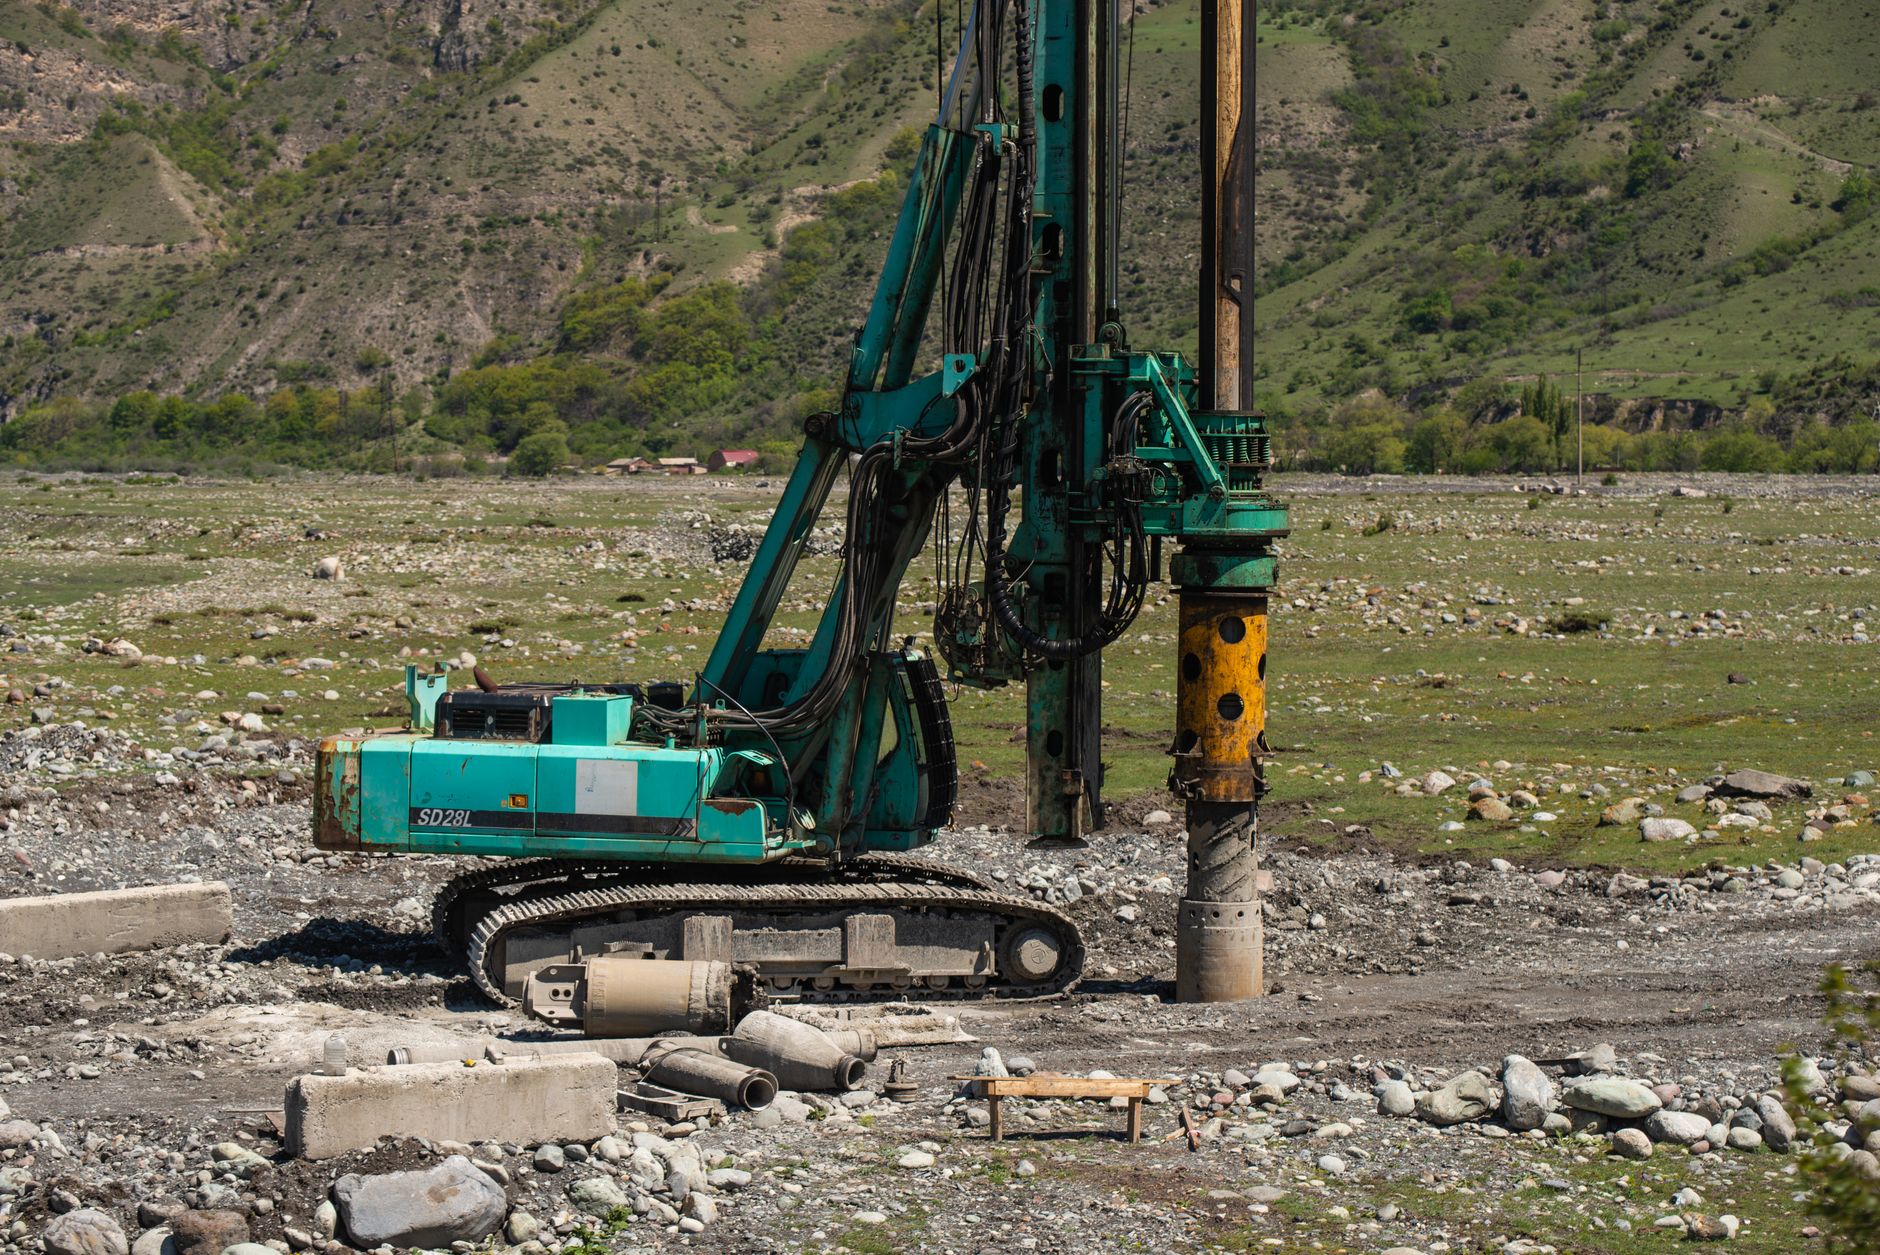
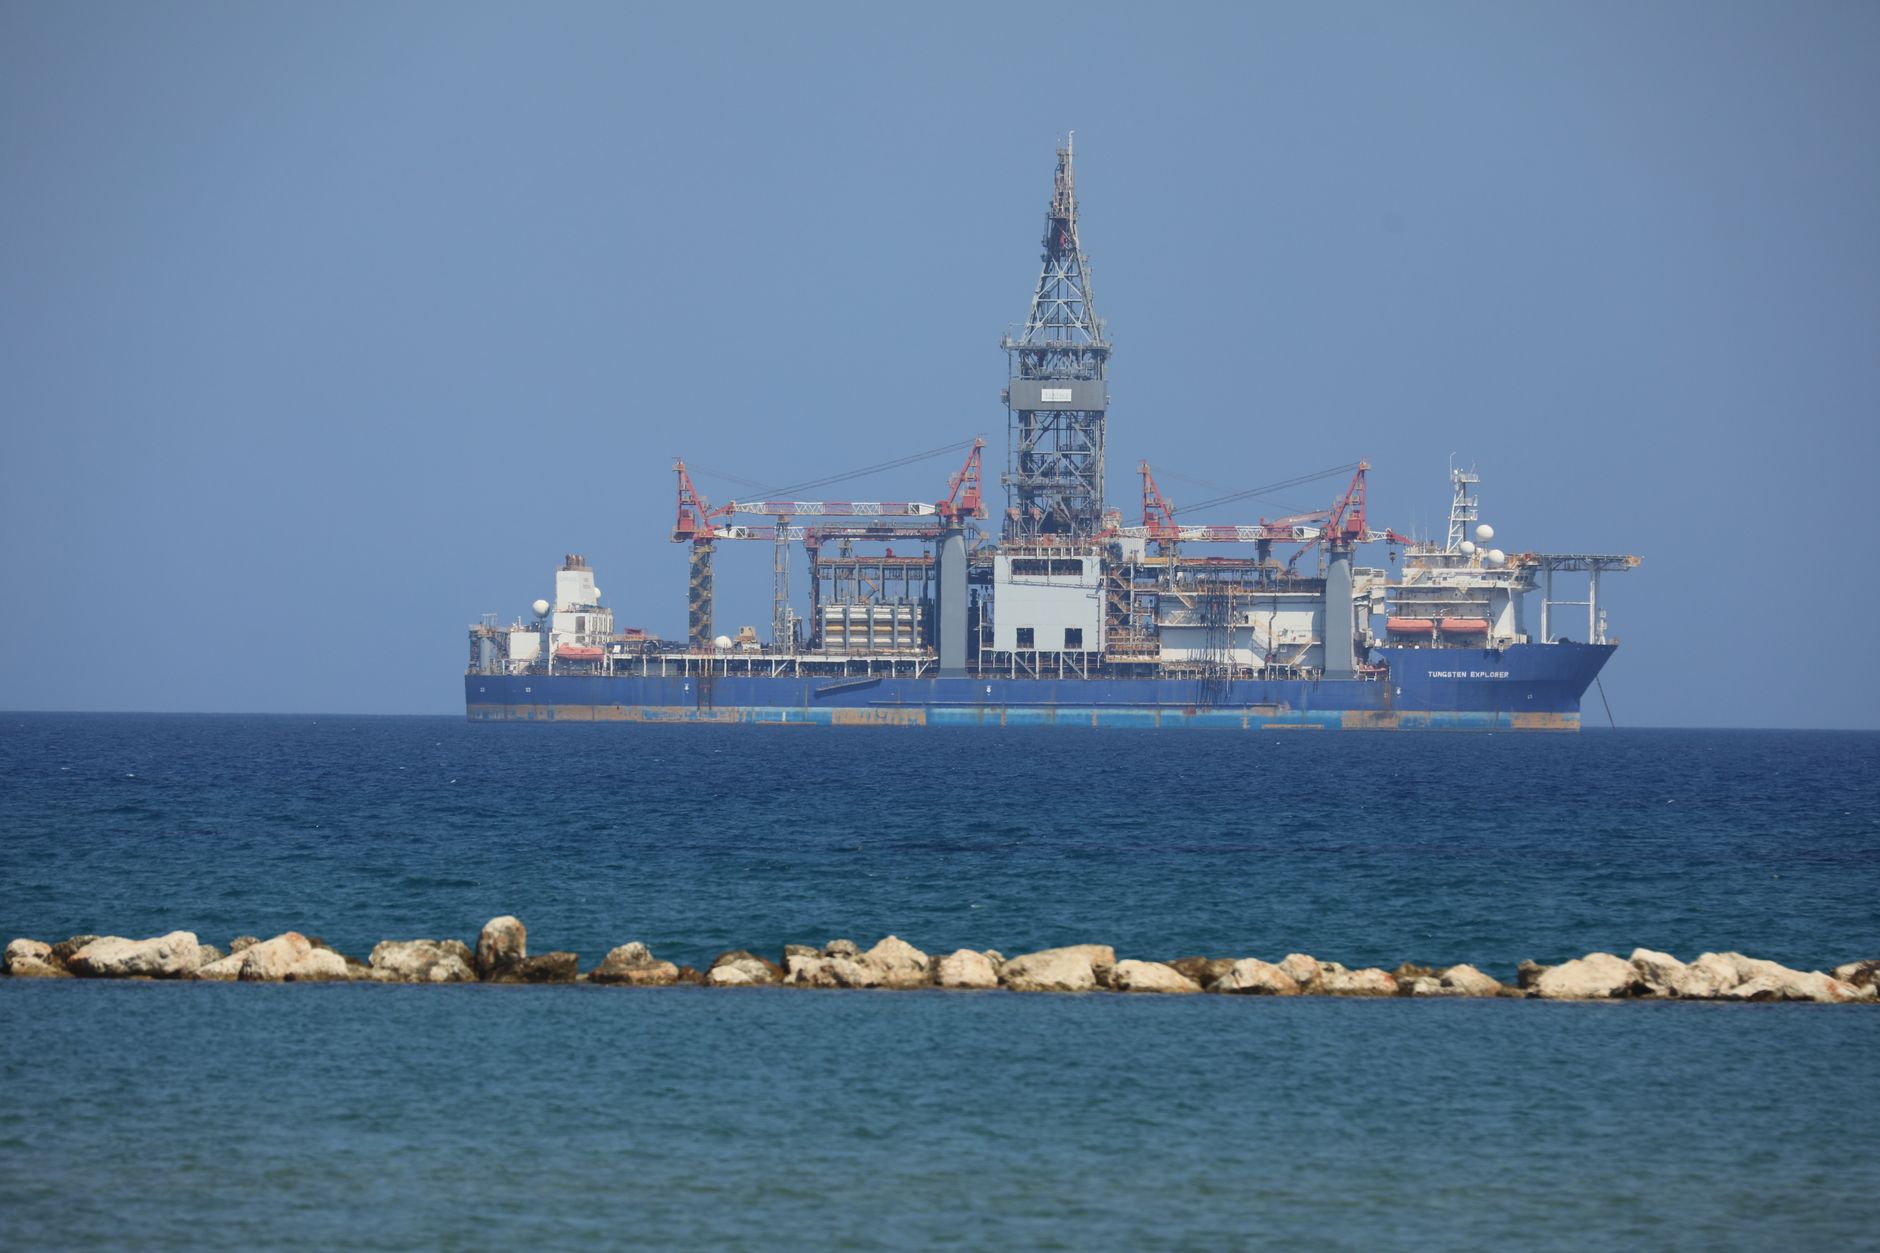
About Precision Drilling Corporation
Precision Drilling Corporation, a drilling company, provides onshore drilling services to exploration and production companies in the oil and natural gas and geothermal industries in the United States, Canada, and internationally. It operates through Contract Drilling Services; and Completion and Production Services segments. The Contract Drilling Services segment offers onshore well drilling services to exploration and production companies in the oil, natural gas, and geothermal industry. This segment also offers services, including turnkey drilling contracts; and procurement and distribution of oilfield supplies, as well as manufacture, sale, and repair of drilling and service rig equipment. In addition, the company offers automation solutions for drilling operations comprising AlphaAutomation, AlphaTM, AlphaApps, AlphaAnalytics, and AlphaARMS; and EverGreen suite of environmental solutions. The Completion and Production Services segment provide service rigs for well completion, workover, abandonment, maintenance, and re-entry preparation services; equipment rentals; and camp and catering services to oil and natural gas exploration and production companies. This segment also operates well completion and workover services. Precision Drilling Corporation was founded in 1951 and is headquartered in Calgary, Canada.
Financials
- Revenue (TTM)
- $1.87B
- EBITDA
- $462.71M
- Profit Margin
- -0.82%
- ROE (TTM)
- -0.84%
- EPS (Diluted)
- -1.04
- Book Value
- 124.97
Classification
- Sector
- Energy
- Industry
- Energy Equipment & Services
- Group
- Energy
Advertisement
7 stocks to buy and hold forever
Blue-chip dividend stocks for long-term wealth building.
Get the FREE ReportExplore More
Common Questions About PD
Articles Featuring PD.TO
Latest articles and analysis covering PD.TO
What's Going On With Precision Drilling Corporation Stock Thursday?
Precision Drilling Corporation's stock has seen a slight decline this week amidst some notable corporate changes. The latest news includes a board member stepping down and the company filing its annual disclosure documents. Investors should keep an eye on these developments as they could affect future stock performance.

Why Precision Drilling Corporation stock is sliding today
Precision Drilling Corporation's stock fell 2.58% in the last trading session, closing at CA$115.12, raising concerns about its market positioning and future outlook.

Why Precision Drilling Corporation stock is rising today
Precision Drilling Corporation's stock rose by 3.38%, driven by optimism around its upcoming dual listing on NYSE Texas. This strategic move is expected to enhance the company's market presence and attract new investors.
Why Precision Drilling Corporation stock is tanking today
Precision Drilling Corporation (PD.TO) experienced a 1.80% decline in its stock price, closing at CA$113.21. This drop raises concerns among investors, especially in the absence of any recent positive developments.
Why Precision Drilling Corporation stock is rising today
Precision Drilling Corporation's stock rose 3.55% in the last trading session, closing at CA$111.37. The increase is attributed to investor optimism surrounding the company's dual listing on NYSE Texas and its strategic focus on capital allocation.

Why Precision Drilling Corporation stock is rising today
Precision Drilling Corporation's stock rose by 2.54% today, closing at CA$110.28. This uptick is seen as a positive sign amid ongoing developments in the energy sector, particularly with the company's upcoming dual listing on NYSE Texas.

Why Precision Drilling Corporation stock is tanking today
Precision Drilling Corporation's stock dropped by 1.85% in the last trading session, closing at CA$110.17. This decline raises questions about the company's financial stability and future performance.

Why Precision Drilling Corporation stock is plummeting today
Precision Drilling Corporation's stock price fell sharply today, closing down 6.73% as investors reacted to ongoing uncertainties in the energy sector. With a market cap of CA$1.54 billion, the company faces challenges that could affect its long-term growth prospects.

Why Precision Drilling Corporation stock is plummeting today
Precision Drilling Corporation's stock fell sharply by 6.11% in the last session, raising concerns among investors about its future performance amidst ongoing market challenges.