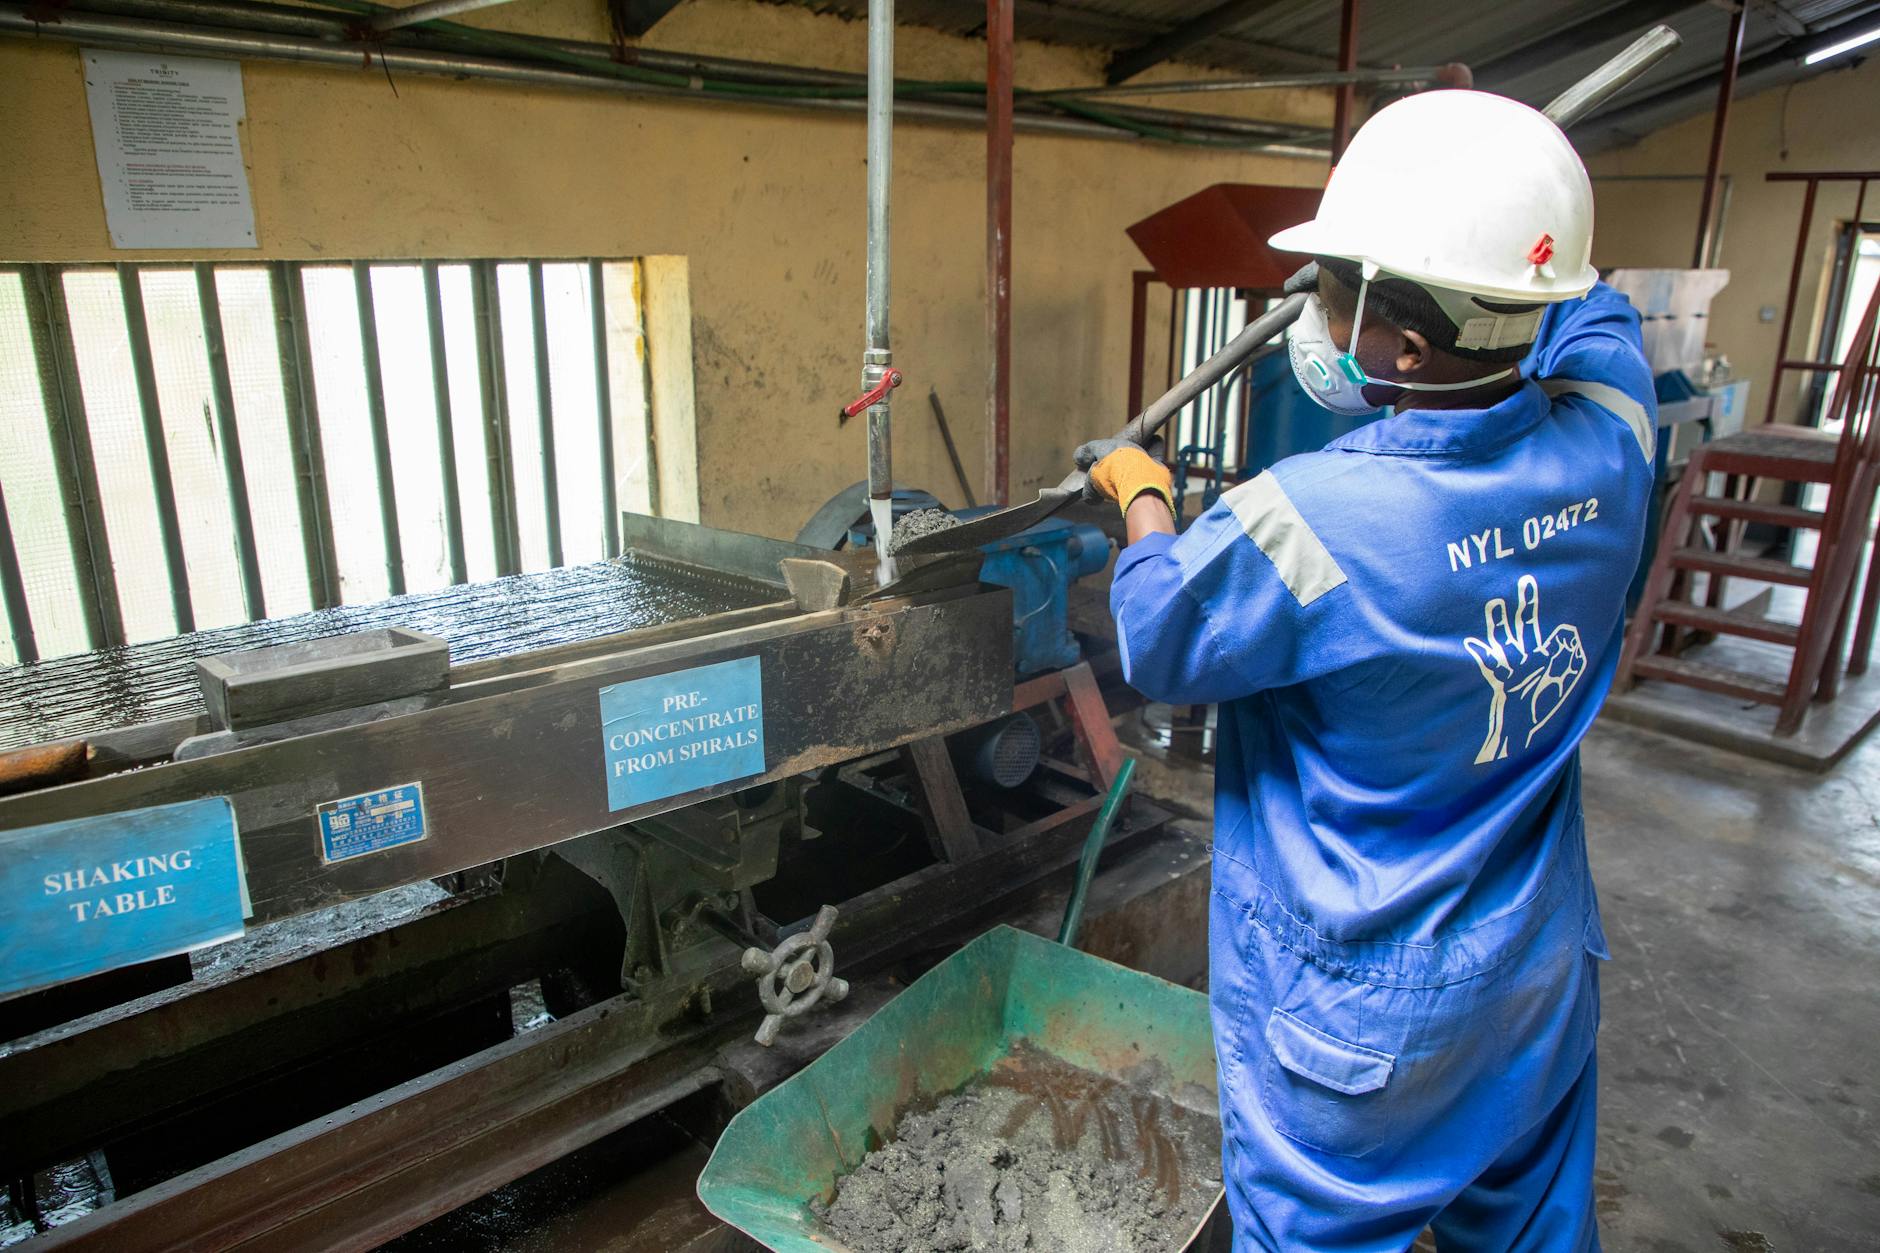
Silvercorp Metals Inc saw a 6% increase in its stock price during the last session, driven by a notable rise in silver prices. This movement highlights the company's sensitivity to commodity fluctuations.
In the last trading session, Silvercorp Metals Inc (SVM.TO) gained 6%, reflecting the recent uptick in silver prices. As a key player in the silver mining sector, the company's performance is closely tied to market trends in precious metals, making this rally particularly significant for investors.
Investor takeaway: Short-term traders may find opportunities in the current momentum, while long-term investors should focus on the broader commodity trends.
Advertisement

Get up to $2,000 cash back
Open and fund a new Qtrade account with promo code SPRING26. Offer ends July 31, 2026.
Silvercorp Metals Inc
SVM.TO
SVM.TO
Silvercorp Metals Inc
 WealthAwesome
Market cap
$2.98B
52W high
$21.59
52W low
$5.88
1W change
-8.86%
Beta
1.97
Analyst Price Targets
Based on analyst covering SVM
Wall Street analysts forecast SVM stock price to rise 57.9% over the next 12 months.
Consensus
BullishBased on avg. target vs last close (formal rating unavailable for Canadian listings)
Avg. Target
C$21.28
+57.9% Upside
Current Price
C$13.48
Last close
Analyst ratings and price targets are updated periodically. Not financial advice.
Wealth Awesome Price Forecast
WA ModelStatistical 90-day price range based on SVM's historical volatility
30-Day Vol
82.6%
Annualized
90-Day Vol
73.1%
Annualized
Trend (90d)
-50.0%
Annualized drift
90d Mean
C$11.28
Expected price
| Horizon | Expected | 68% Range (1σ) |
|---|---|---|
| 30 trading days | C$12.70 | C$9.55 – C$16.89 |
| 60 trading days | C$11.97 | C$8.00 – C$17.91 |
| 90 trading days | C$11.28 | C$6.88 – C$18.48 |
Methodology: Range is calculated using 30-day realized volatility via geometric Brownian motion (log-normal model). 68% band = ±1σ, 95% band = ±2σ. This is a statistical model, not a prediction. Past volatility does not guarantee future results. Not financial advice.
What the 6% Surge Means for Silvercorp's Valuation
The 6% increase in SVM.TO's stock price reflects a broader trend in the silver market, where rising prices can enhance the company's revenue potential. Investors should consider how this surge positions Silvercorp in relation to its market cap of approximately $3.78 billion, especially if silver prices continue to rise in the coming weeks.
Bull case
Strong correlation with silver prices: Silvercorp is directly affected by changes in the silver market, which have seen a recent uptick. The 6% gain shows strong market confidence, which could attract more investors. If silver prices keep rising, it could lead to better revenue and profits for the company.
Bear case
Volatility risks: Silver prices can be unpredictable, which may cause SVM.TO's stock performance to fluctuate. If silver prices drop, the recent gains could quickly reverse, affecting investor sentiment. Additionally, the lack of recent company-specific news might leave the stock vulnerable to broader market trends rather than its own fundamentals.
How Silver Prices Drive Silvercorp's Stock Performance
Silvercorp Metals Inc's stock is heavily influenced by fluctuations in silver prices. As silver gains traction in the market, companies like Silvercorp benefit from increased investor interest and potential revenue growth. This 6% rise indicates that traders are optimistic about the short-term outlook for silver, which could lead to further gains for SVM.TO if the trend continues.
Understanding the Volatility in Precious Metals
While the recent rally in silver prices has boosted Silvercorp's stock, investors should remain cautious. The precious metals market is known for its volatility, and any sudden downturn in silver prices could quickly reverse the gains seen in SVM.TO. Long-term investors might want to keep an eye on macroeconomic factors influencing silver demand, such as industrial usage and investment trends.
Advertisement