Energy Fuels Inc (EFR : TSX)
Common Stock
$17.77
CAD
-0.83 (-4.46%)
Last updated: 2026-07-15
EFR
Energy Fuels Inc
Performance
1 Day
-4.46%
1 Week
-4.36%
1 Month
-18.71%
YTD
-22.54%
Key Statistics
Market Cap
$4.65B
52W High
$38.37
52W Low
$11.25
P/E Ratio
-
50 Day MA
$23.56
200 Day MA
$25.44
Beta
1.58
Dividend Yield
-
Technical Indicators
Price vs 50-Day SMA
Price vs 200-Day SMA
Recent Price History
| Date | Open | High | Low | Close | Adj Close | Volume |
|---|---|---|---|---|---|---|
| 7/15/2026 | $18.67 | $18.72 | $17.40 | $17.77 | $17.77 | 622,492 |
| 7/14/2026 | $18.82 | $19.12 | $18.50 | $18.60 | $18.60 | 398,391 |
| 7/13/2026 | $19.03 | $19.07 | $18.28 | $18.49 | $18.49 | 345,616 |
| 7/10/2026 | $19.73 | $20.11 | $19.05 | $19.23 | $19.23 | 422,710 |
| 7/9/2026 | $18.76 | $19.30 | $18.58 | $19.07 | $19.07 | 513,571 |
| 7/8/2026 | $18.01 | $18.61 | $17.87 | $18.58 | $18.58 | 546,506 |
| 7/7/2026 | $19.49 | $19.49 | $17.87 | $18.28 | $18.28 | 714,448 |
| 7/6/2026 | $19.74 | $20.30 | $19.48 | $19.57 | $19.57 | 342,986 |
| 7/3/2026 | $19.98 | $20.06 | $19.66 | $19.87 | $19.87 | 200,674 |
| 7/2/2026 | $20.35 | $21.23 | $19.27 | $19.53 | $19.53 | 607,423 |
Analyst Price Targets
Based on analyst covering EFR
Wall Street analysts forecast EFR stock price to rise 125.8% over the next 12 months.
Consensus
BullishBased on avg. target vs last close (formal rating unavailable for Canadian listings)
Avg. Target
C$40.13
+125.8% Upside
Current Price
C$17.77
Last close
Analyst ratings and price targets are updated periodically. Not financial advice.
Wealth Awesome Price Forecast
WA ModelStatistical 90-day price range based on EFR's historical volatility
30-Day Vol
74.8%
Annualized
90-Day Vol
77.8%
Annualized
Trend (90d)
-50.0%
Annualized drift
90d Mean
C$14.86
Expected price
| Horizon | Expected | 68% Range (1σ) |
|---|---|---|
| 30 trading days | C$16.74 | C$12.94 – C$21.67 |
| 60 trading days | C$15.78 | C$10.95 – C$22.72 |
| 90 trading days | C$14.86 | C$9.51 – C$23.24 |
Methodology: Range is calculated using 30-day realized volatility via geometric Brownian motion (log-normal model). 68% band = ±1σ, 95% band = ±2σ. This is a statistical model, not a prediction. Past volatility does not guarantee future results. Not financial advice.
About Energy Fuels Inc
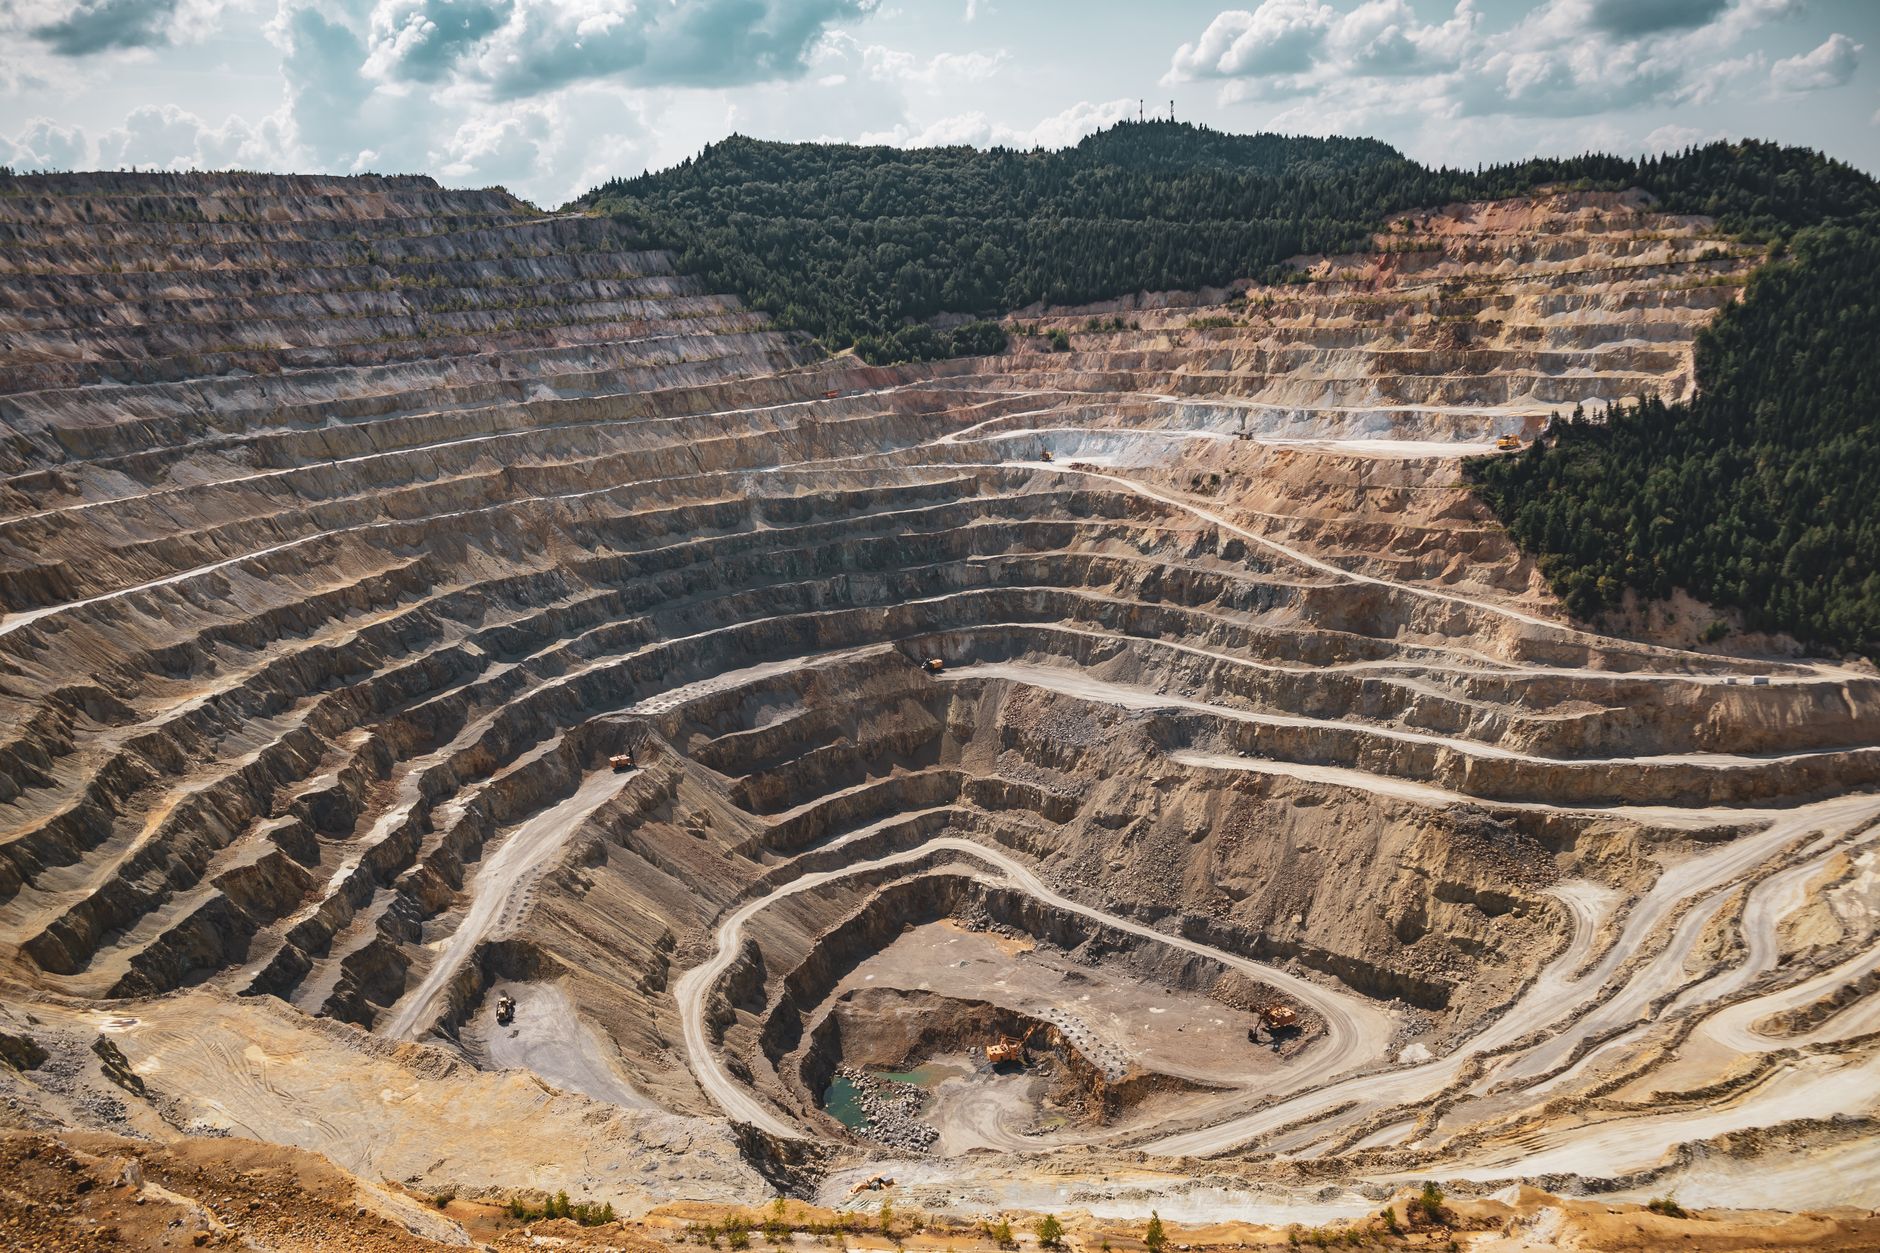
Energy Fuels Inc., together with its subsidiaries, engages in the exploration, recovery, recycling, exploration, operation, development, permitting, evaluation, and sale of uranium mineral properties in the United States. It operates through three segments: Uranium, REE, and HMS. It produces and sells vanadium pentoxide, rare earth elements, carbonate, and heavy mineral sands, such as ilmenite, rutile, zircon, and monazite. The company was formerly known as Volcanic Metals Exploration Inc. and changed its name to Energy Fuels Inc. in May 2006. Energy Fuels Inc. was incorporated in 1987 and is headquartered in Lakewood, Colorado.
Financials
- Revenue (TTM)
- $84.86M
- EBITDA
- $-81.17M
- Profit Margin
- -82.70%
- ROE (TTM)
- -10.78%
- EPS (Diluted)
- -0.41
- Book Value
- 4.19
Classification
- Sector
- Energy
- Industry
- Oil, Gas & Consumable Fuels
- Group
- Energy
Advertisement
7 stocks to buy and hold forever
Blue-chip dividend stocks for long-term wealth building.
Get the FREE ReportExplore More
Common Questions About EFR
Articles Featuring EFR.TO
Latest articles and analysis covering EFR.TO
Why Energy Fuels Inc stock is sliding today
Energy Fuels Inc (EFR.TO) has seen its stock price decrease by 4.30% today, closing at CA$17.80. This decline raises questions about the company's financial stability and its ability to capitalize on growth opportunities in the uranium sector.
What's Going On With Energy Fuels Inc Stock Tuesday?
Energy Fuels Inc has faced a challenging week, with stock prices declining and ongoing discussions about its liquidity and market position. Investors are advised to consider recent insider activity and analyst outlooks as they navigate this volatility.

Why Energy Fuels Inc stock is rising today
Energy Fuels Inc (EFR.TO) saw its stock rise by 4.09% as investors respond to the growing challenges in the US rare earth supply chain, highlighting the company's strategic positioning in this critical sector.

Why Energy Fuels Inc stock is sliding today
Energy Fuels Inc's recent stock slide reflects broader market pressures and specific challenges facing the company, including a cut in analyst price targets and execution risks in its expansion plans.

Why Energy Fuels Inc stock is plummeting today
Energy Fuels Inc's recent stock performance has raised alarms among investors as it faces a significant drop of 5.19% in one day. With a market cap of CA$4.88 billion and ongoing operational challenges, the company's future remains uncertain.

Why Energy Fuels Inc stock is sliding today
Energy Fuels Inc (EFR.TO) has experienced a 3.11% decline in its stock price, reflecting ongoing challenges in the uranium market and execution risks in its expansion strategy. As the company aims to diversify into critical minerals, investors are left questioning the viability of its growth plans amidst recent performance struggles.

Energy Fuels Inc. (EFR.TO) Slides 8% This Week Amid Acquisition News
Energy Fuels Inc. has dropped 8% this week, raising concerns about its recent acquisition of Vacuumschmelze and its implications for future growth.

Why Energy Fuels Inc stock is sliding today
Energy Fuels Inc's stock has taken a hit, dropping 3.98% in the latest trading session. Investors are reacting to a mix of broader market trends and specific concerns regarding the company's financial outlook and strategic initiatives.

Why Energy Fuels Inc stock is sliding today
Energy Fuels Inc's stock is down by 2.95% today, closing at CA$20.75. Despite ambitious plans for growth, investor sentiment remains cautious, as reflected in the stock's recent performance.
Why Energy Fuels Inc stock is tanking today
Energy Fuels Inc's stock is down 1.20% today, closing at CA$23.11. Investors are reacting to the company's ongoing challenges despite securing a significant loan for expansion.
Why Energy Fuels Inc stock is skyrocketing today
Energy Fuels Inc (EFR.TO) has seen a significant uptick in its stock price, driven by promising developments in its rare-earth elements segment. The company's recent financing commitment from the Department of Defense is a pivotal factor in this surge, signaling potential growth in a sector that is becoming increasingly vital.

Why Energy Fuels Inc stock is rising today
Energy Fuels Inc's stock has risen by 2.79% as the company successfully meets its uranium output targets and expands into the rare earth market, showcasing its potential in the critical minerals sector.

Why Energy Fuels Inc stock is skyrocketing today
Energy Fuels Inc's stock has seen a significant rise of 10.48% today, fueled by optimism surrounding leadership changes and production advancements.

Why Energy Fuels Inc stock is rising today
Energy Fuels Inc's stock has risen by 4.18%, driven by investor optimism surrounding its recent leadership changes and production capabilities in uranium and rare earth materials.

Energy Fuels Inc Surges 9% in One Day on Undervalued Stock List
Energy Fuels Inc saw a 9% increase in its stock price, driven by its recognition as an undervalued stock. Investors are weighing the potential for long-term gains against current market conditions.

Energy Fuels Inc Surges 6% in a Day Amid Undervaluation Buzz
Energy Fuels Inc (EFR.TO) rose 6% last session as investors eye its undervaluation potential. With a market cap of CA$7.96 billion, the stock is drawing renewed interest.
Energy Fuels Inc Surges 5% in Last Session as Uranium Demand Rises
Energy Fuels Inc saw a 5% increase in its stock price yesterday, driven by rising uranium demand as a clean energy source. Investors are optimistic about the company's market position.

Energy Fuels Shares Jump Nearly 11% This Week as Uranium Stocks Regain Momentum
Energy Fuels shares climbed 10.95% over the past week, pushing the uranium-focused TSX stock back near multi-month highs as sector momentum builds.

Energy Fuels Stock Surged 14% Yesterday— Here’s What Drove It
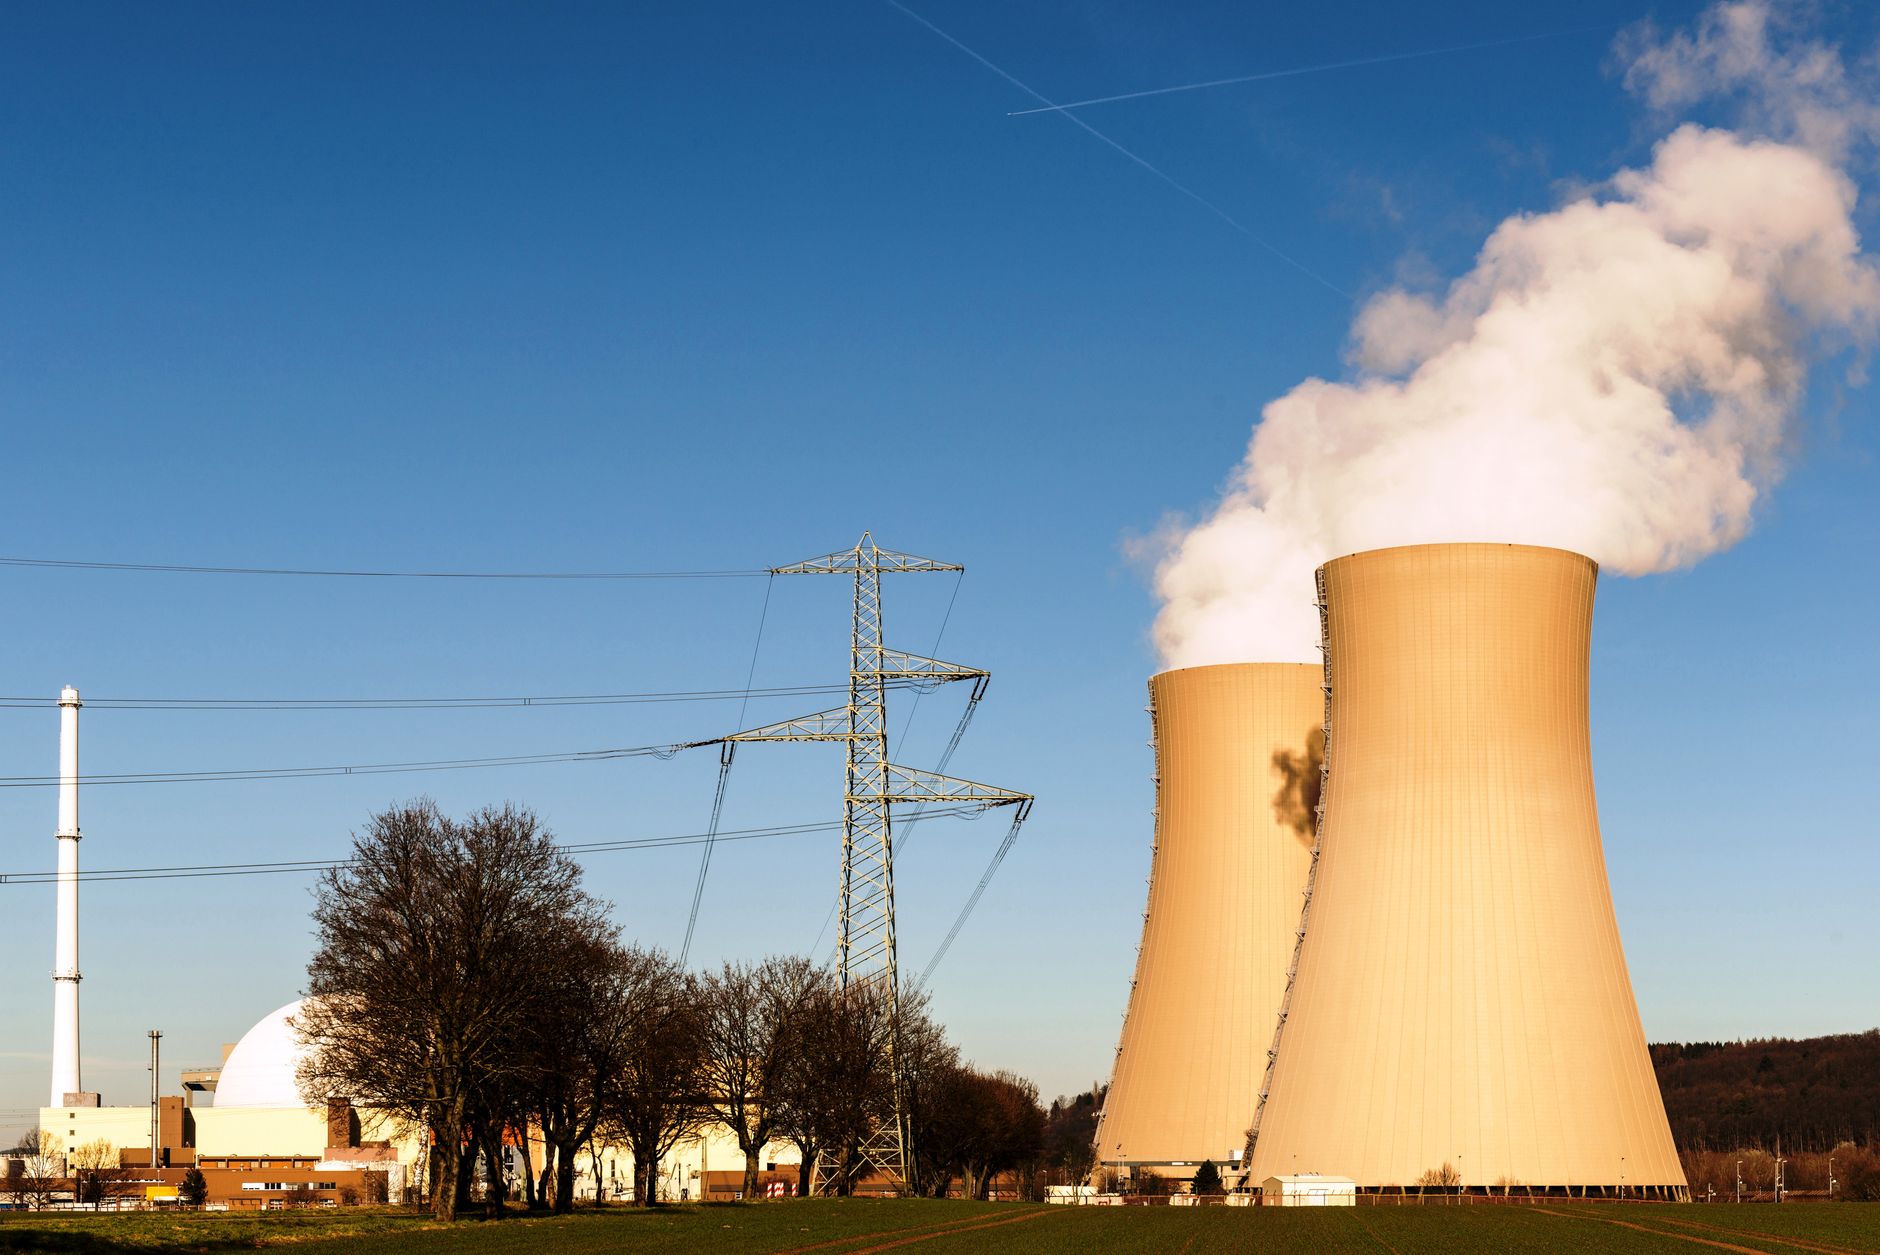
Energy Fuels stock jumped nearly 15% after new U.S. government support for the nuclear fuel supply chain put uranium processing back in focus, driving heavy volume and pushing shares near a 52-week high.
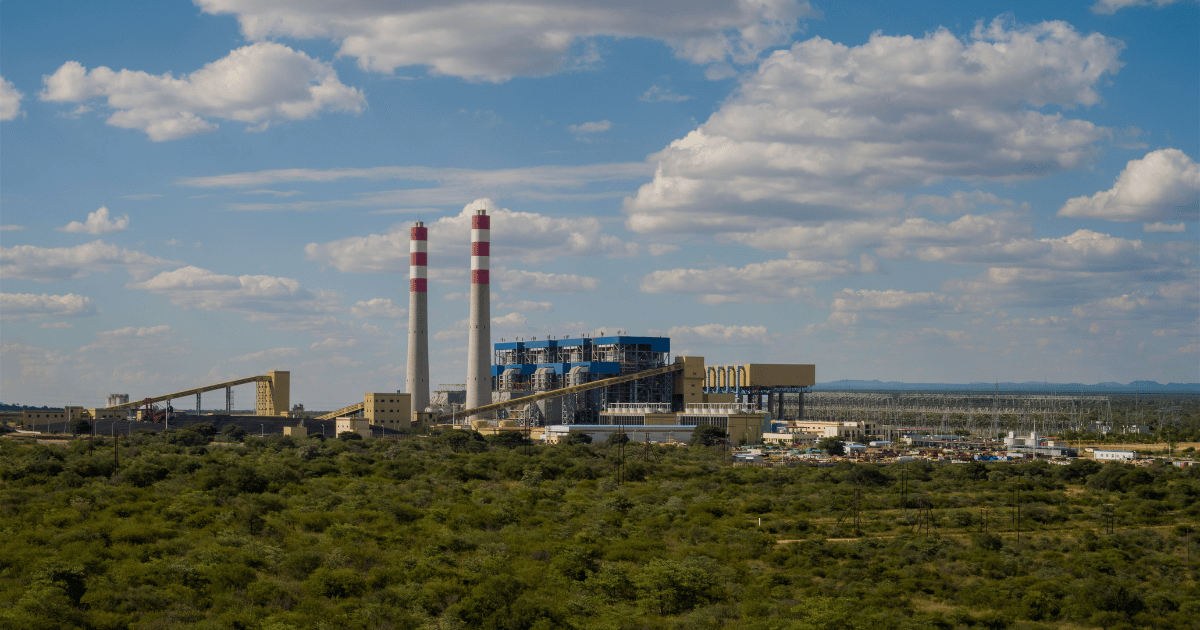
7 Best Uranium Stocks In Canada to Buy in July 2026
Canada is the 39th most populated country in the world, and it produces about 2% of the world’s electricity. Despite the fact that we have considerable resources and a lot of uranium, nuclear power only makes up about 15% of our power generation resource mix, thanks mostly to our reliance on clean h
![7 Best Uranium Stocks In Canada to Buy in [currentmonthyearfull]](https://lhajohzwizrsjmumhpjg.supabase.co/storage/v1/object/public/wealth-awesome/site-media/best-uranium-stocks-in-canada_8.jpg)
Showing latest 20 articles