Bravada Gold Corporation (BVA : TSX-V)
Common Stock
$0.92
CAD
+0.11 (13.58%)
Last updated: 2026-07-22
Get BVA alerts:
BVA
Bravada Gold Corporation
Performance
1 Day
+13.58%
1 Week
+9.52%
1 Month
+22.67%
YTD
+109.09%
Key Statistics
Market Cap
$23.29M
52W High
$1.16
52W Low
$0.24
P/E Ratio
20.25
50 Day MA
$0.76
200 Day MA
$0.61
Beta
2.22
Dividend Yield
-
Technical Indicators
Price vs 50-Day SMA
Price vs 200-Day SMA
Recent Price History
| Date | Open | High | Low | Close | Adj Close | Volume |
|---|---|---|---|---|---|---|
| 7/22/2026 | $0.81 | $0.93 | $0.81 | $0.92 | $0.92 | 146,264 |
| 7/21/2026 | $0.80 | $0.81 | $0.80 | $0.81 | $0.81 | 91,500 |
| 7/17/2026 | $0.76 | $0.76 | $0.76 | $0.76 | $0.76 | 8,192 |
| 7/16/2026 | $0.84 | $0.84 | $0.76 | $0.76 | $0.76 | 90,449 |
| 7/15/2026 | $0.81 | $0.84 | $0.80 | $0.84 | $0.84 | 31,000 |
| 7/14/2026 | $0.84 | $0.84 | $0.84 | $0.84 | $0.84 | 2,500 |
| 7/13/2026 | $0.79 | $0.84 | $0.79 | $0.84 | $0.84 | 80,242 |
| 7/10/2026 | $0.74 | $0.80 | $0.74 | $0.79 | $0.79 | 147,737 |
| 7/9/2026 | $0.69 | $0.80 | $0.69 | $0.74 | $0.74 | 82,559 |
| 7/8/2026 | $0.75 | $0.80 | $0.69 | $0.69 | $0.69 | 24,526 |
Wealth Awesome Price Forecast
WA ModelStatistical 90-day price range based on BVA's historical volatility
30-Day Vol
96.5%
Annualized
90-Day Vol
123.6%
Annualized
Trend (90d)
+23.5%
Annualized drift
90d Mean
C$1.00
Expected price
| Horizon | Expected | 68% Range (1σ) |
|---|---|---|
| 30 trading days | C$0.95 | C$0.68 – C$1.32 |
| 60 trading days | C$0.97 | C$0.61 – C$1.56 |
| 90 trading days | C$1.00 | C$0.56 – C$1.78 |
Methodology: Range is calculated using 30-day realized volatility via geometric Brownian motion (log-normal model). 68% band = ±1σ, 95% band = ±2σ. This is a statistical model, not a prediction. Past volatility does not guarantee future results. Not financial advice.
About Bravada Gold Corporation
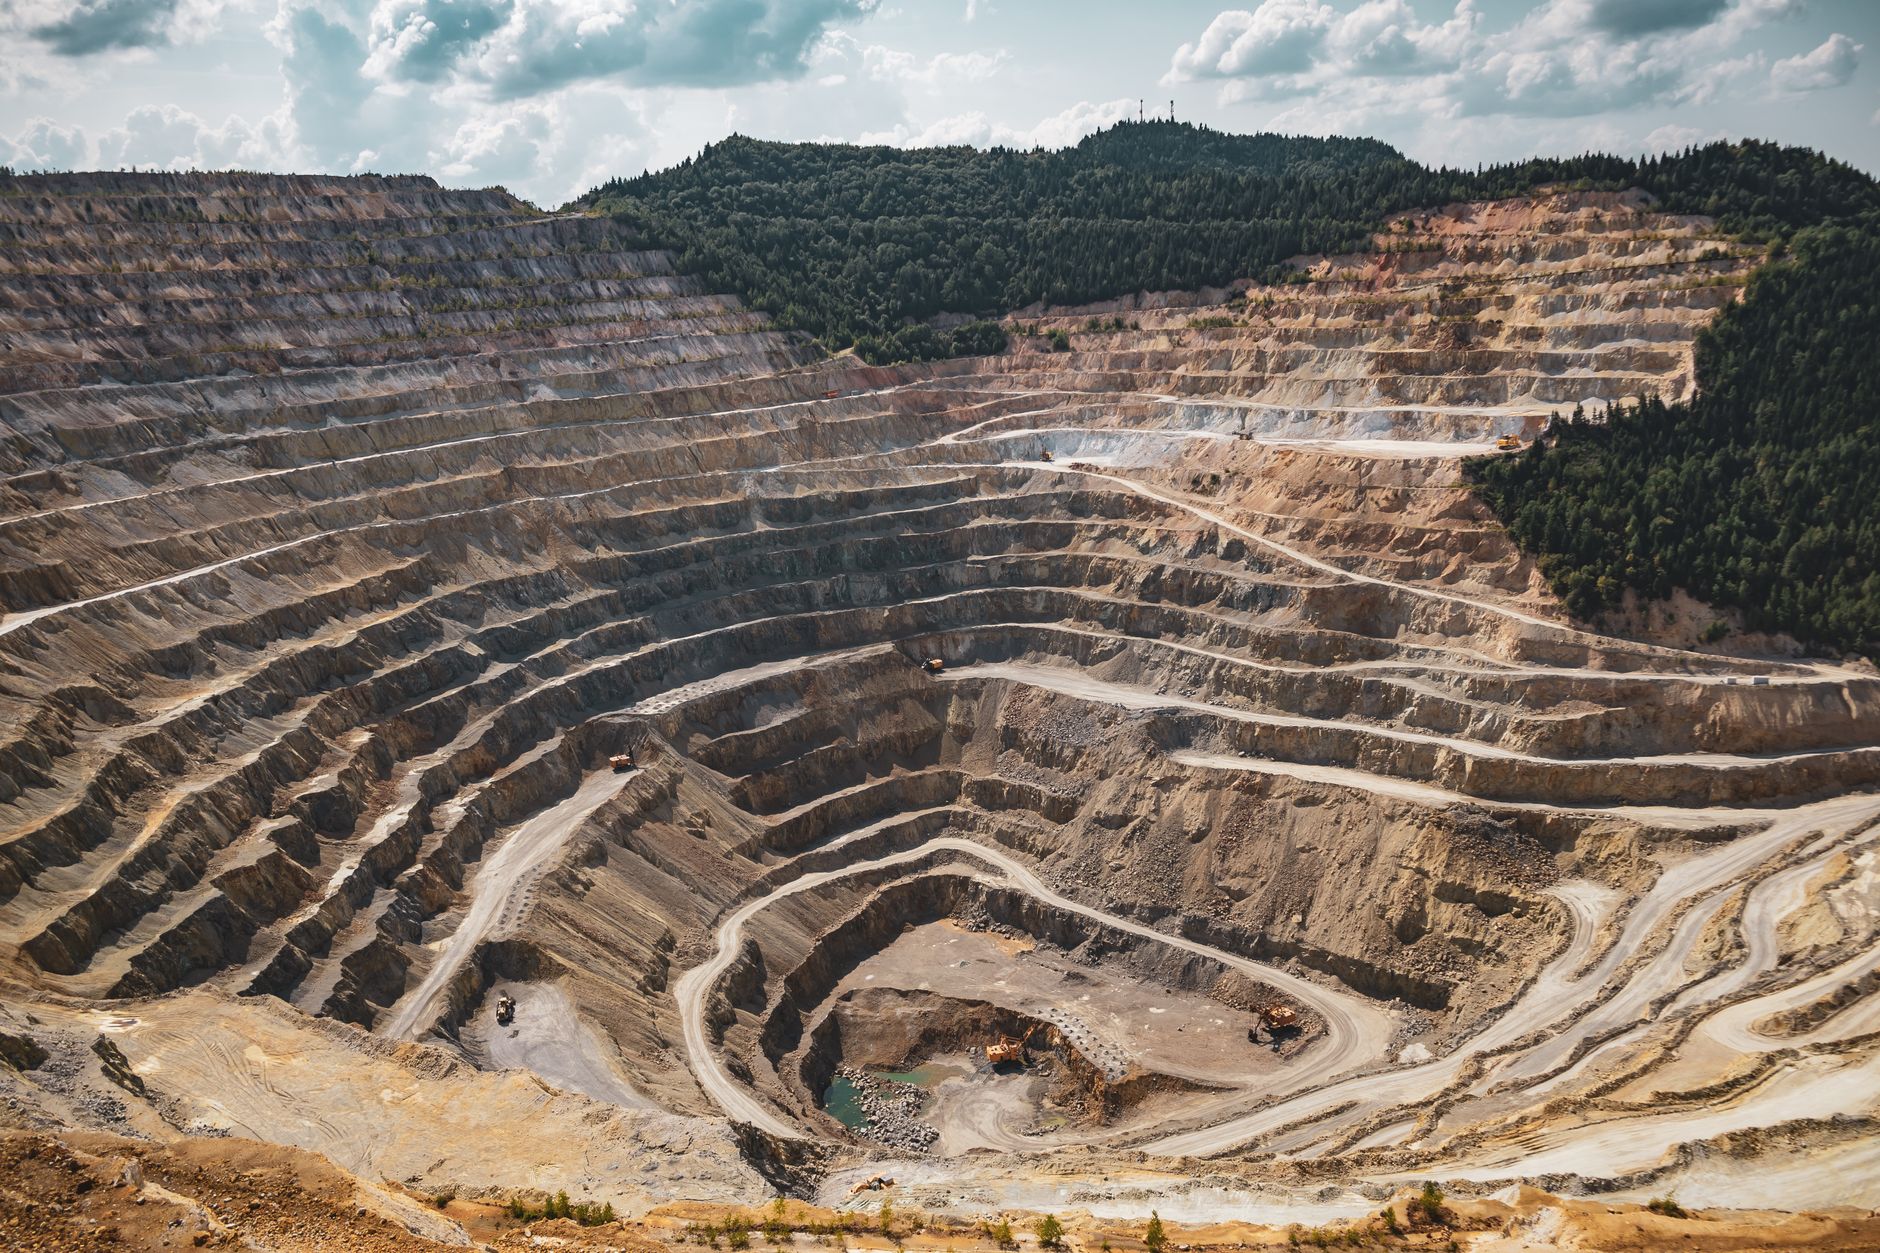
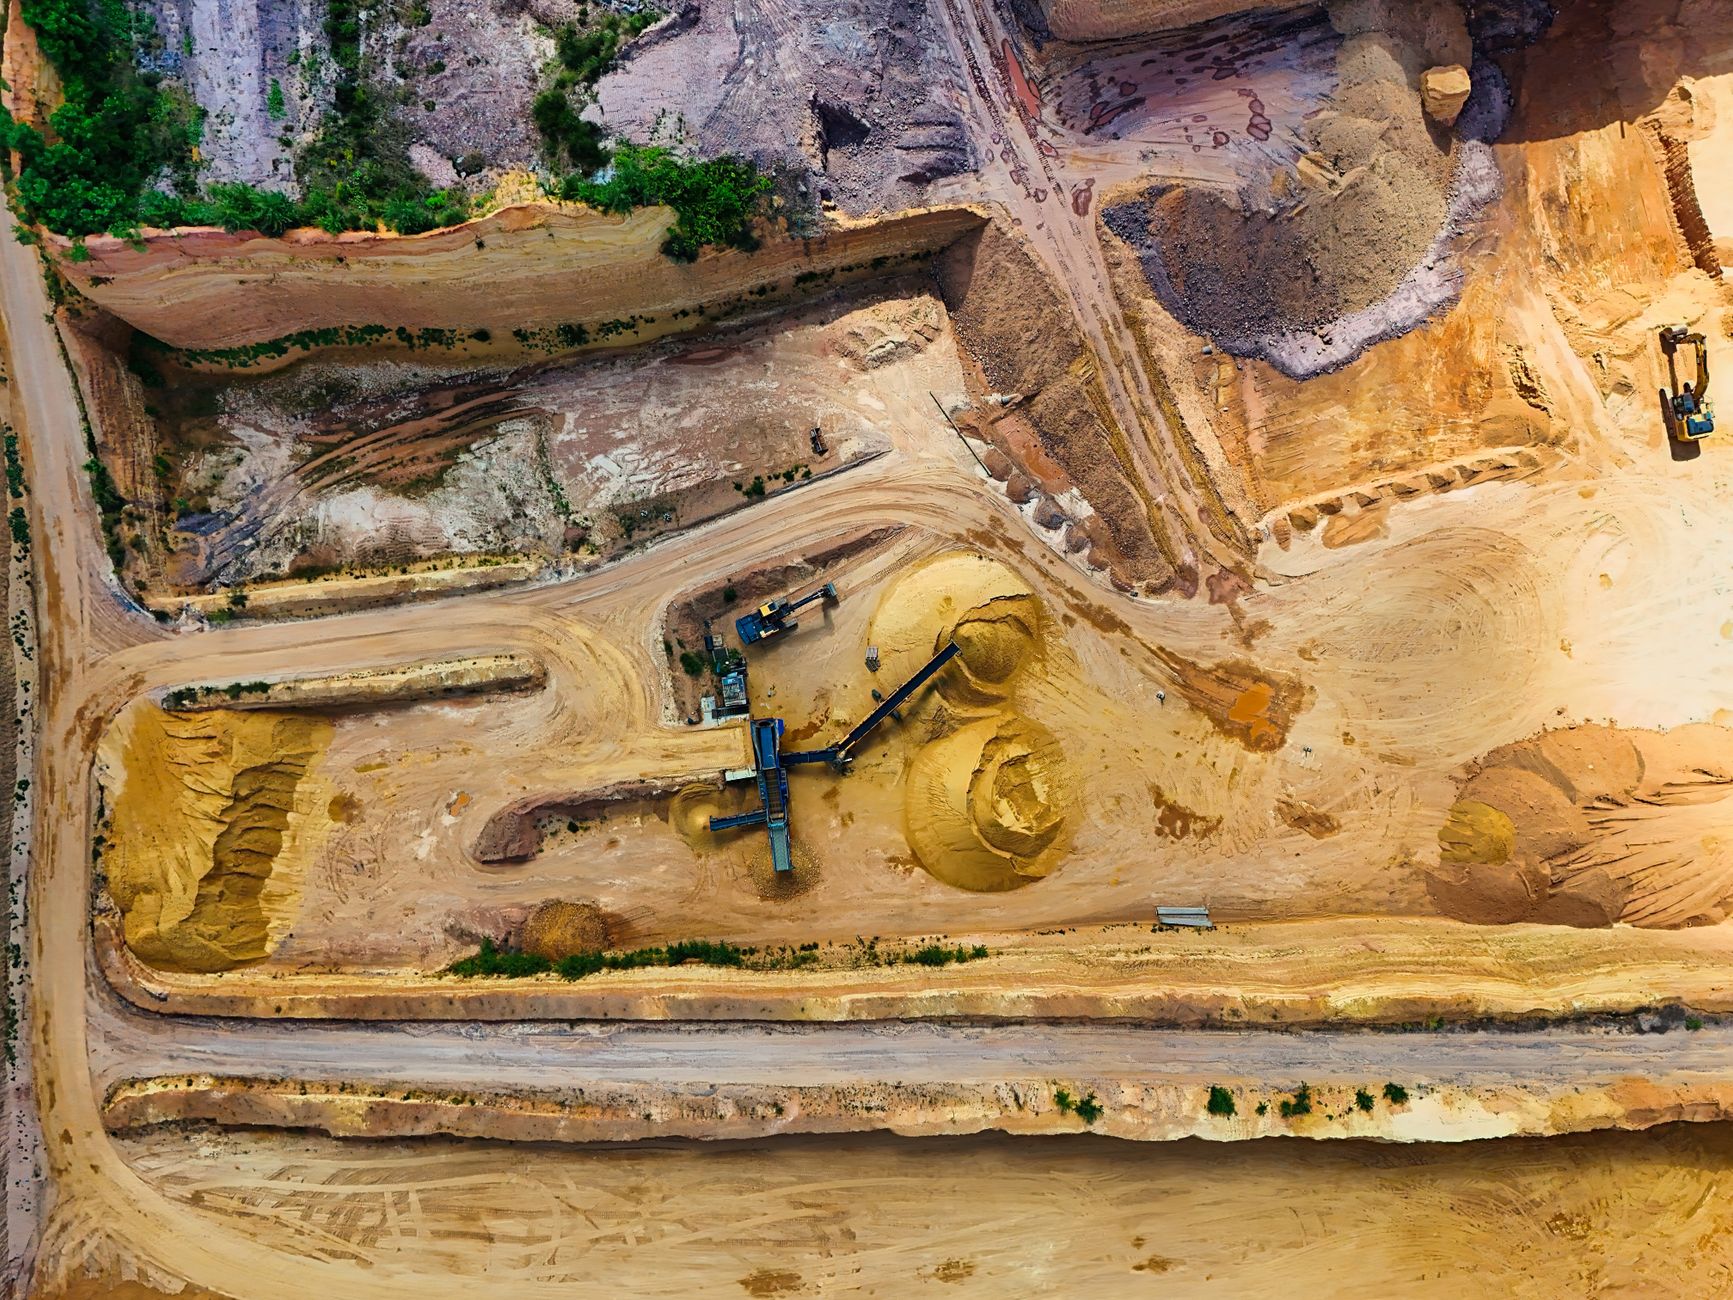
Bravada Gold Corporation, an exploration stage company, engages in the acquisition, exploration, and development of natural resource properties in the United States and Canada. It primarily explores for gold, silver, and other precious metals. The company's flagship property is the 100% owned Wind Mountain gold and silver property located in northwestern Nevada. Bravada Gold Corporation was incorporated in 2009 and is based in Vancouver, Canada.
Financials
- Revenue (TTM)
- $0
- EBITDA
- $-1.23M
- Profit Margin
- 0.00%
- ROE (TTM)
- -918.34%
- EPS (Diluted)
- 0.04
- Book Value
- 0.04
Classification
- Sector
- Materials
- Industry
- Metals & Mining
- Group
- Materials
🔄 Recent Splits
1-for-8
Mar 2, 2026
Advertisement
7 stocks to buy and hold forever
Blue-chip dividend stocks for long-term wealth building.
Get the FREE ReportExplore More
Common Questions About BVA
Articles Featuring BVA.V
Latest articles and analysis covering BVA.V
Why Bravada Gold Corporation stock surged yesterday
Bravada Gold Corporation's stock surged by 13.58% yesterday, closing at CA$0.92, as investors reacted positively to recent corporate developments.
Why Bravada Gold Corporation stock is skyrocketing today
Bravada Gold Corporation's stock surged by over 8% in the last trading session, closing at CA$0.80. This increase reflects positive investor sentiment as the company advances its Wind Mountain Gold Project.
Why Bravada Gold Corporation stock is plummeting today
Bravada Gold Corporation's stock plummeted by 9.21% in the last session, raising questions about its future as it navigates challenges in the mining sector.

Why Bravada Gold Corporation stock is skyrocketing today
Bravada Gold Corporation's stock soared today, driven by strategic corporate moves and updates on its Wind Mountain project. With a closing price of CA$0.80, investors are optimistic about the company's future.

Why Bravada Gold Corporation stock is plummeting today
Bravada Gold Corporation's stock has dropped significantly, closing at CA$0.72 after a decline of 11.11%. Investors are left questioning the company's future amidst a lack of recent news and ongoing market volatility.

Why Bravada Gold Corporation stock is plummeting today
Bravada Gold Corporation's stock plummeted by over 16% in a single trading day, reflecting investor concerns and a potential lack of confidence in the company's future.

Bravada Gold Corporation Reports Earnings: What’s Next for BVA.V?
Bravada Gold Corporation's upcoming earnings report lacks EPS figures, but recent strategic developments may influence investor sentiment significantly.

Why Bravada Gold Corporation stock is skyrocketing today
Bravada Gold Corporation's stock saw a significant rise of 11.11% in the last trading session, driven by strategic decisions and updates on its key projects. Investors are optimistic about the company's future prospects.

Why Bravada Gold Corporation stock is rising today
Bravada Gold Corporation's stock saw a 2.78% increase, reflecting positive investor sentiment as the company continues to advance its projects in the gold sector.

Why Bravada Gold Corporation stock is plummeting today
Bravada Gold Corporation's stock plummeted by 9.33% today, reflecting growing investor concerns over its recent announcements and overall market sentiment.
