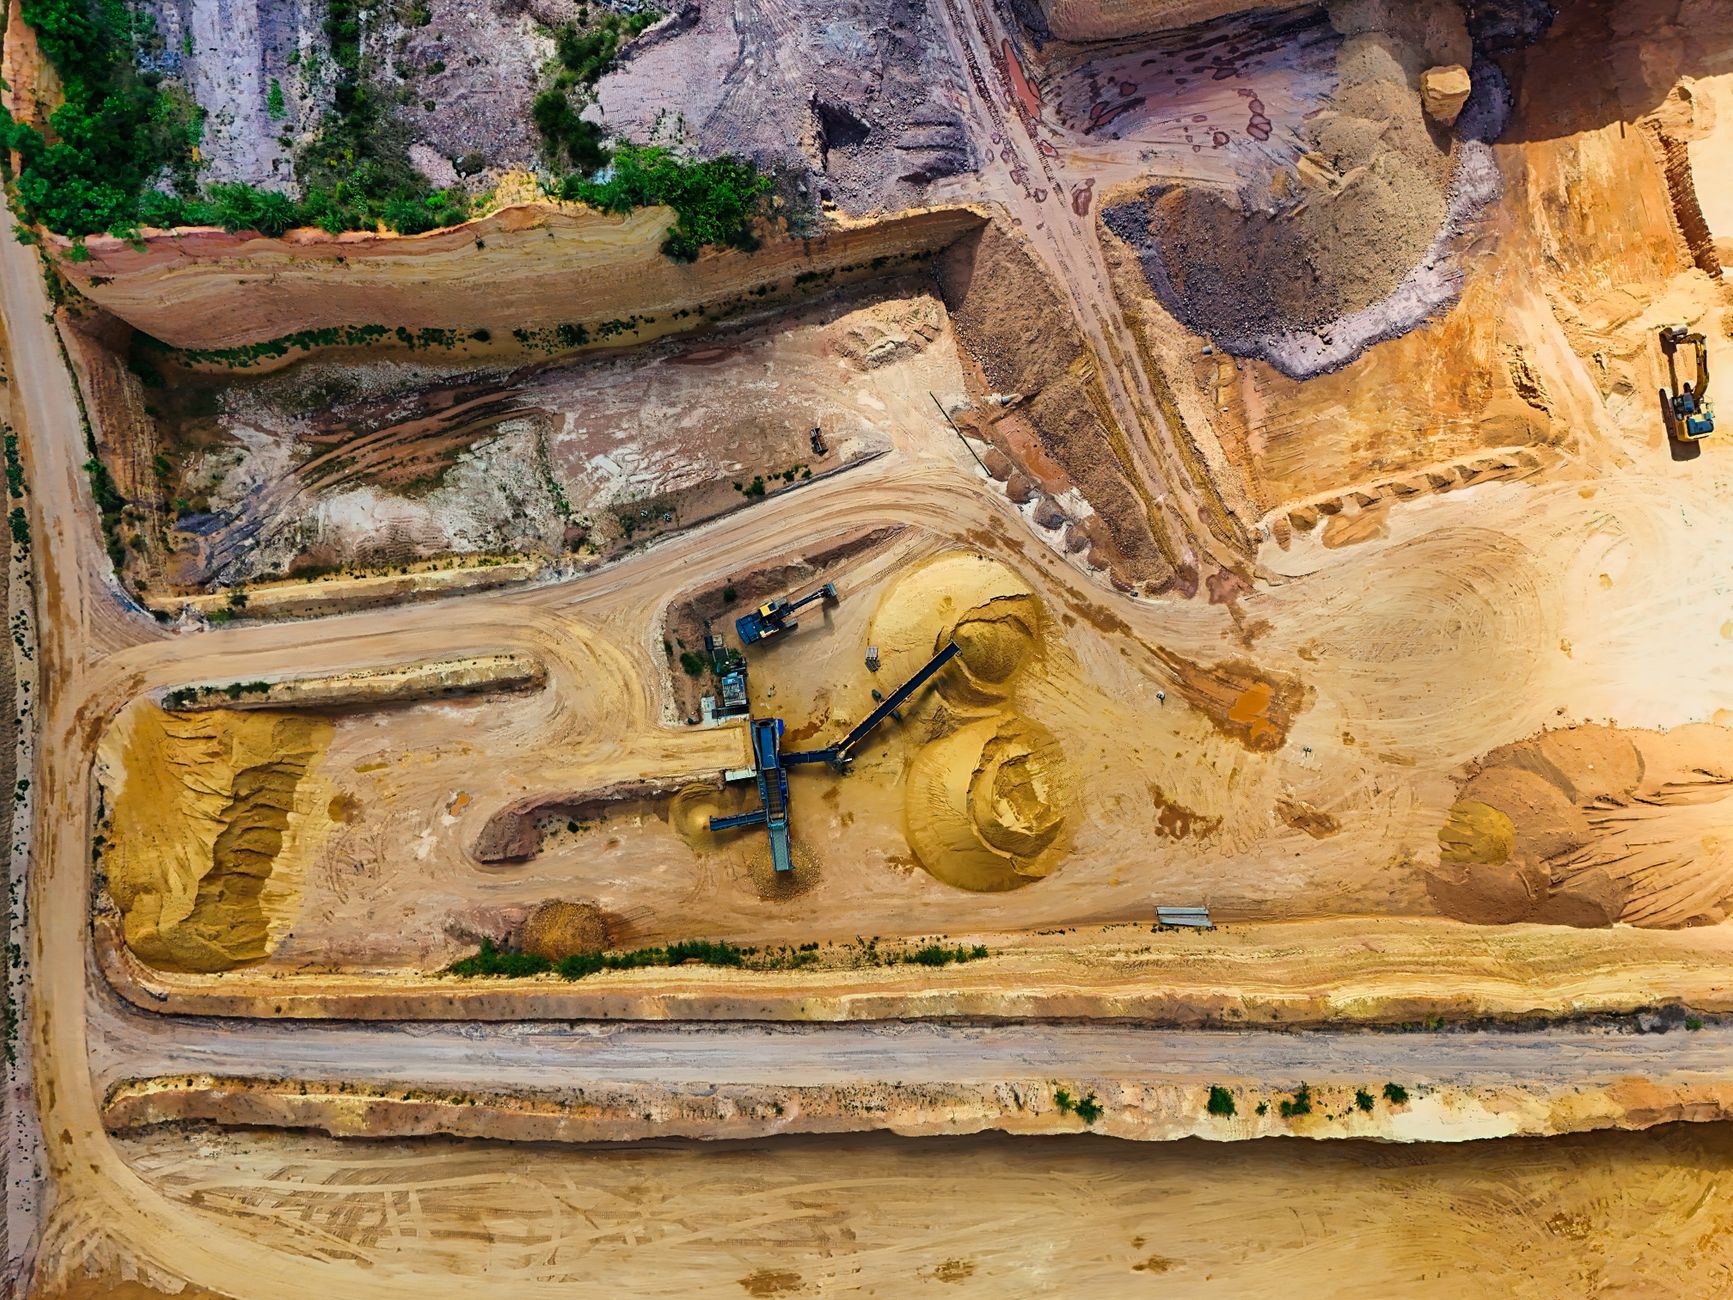
Aclara Resources Inc experienced a notable decline in its stock price during the last trading session, reflecting investor caution amidst a lack of significant news.
In the latest trading session, Aclara Resources Inc (ARA.TO) saw its stock price drop by 2.23%, closing at CA$3.95. This decline comes as investors weigh the company's recent activities against broader market conditions, leading to a cautious outlook.
Advertisement

Get up to $2,000 cash back
Open and fund a new Qtrade account with promo code SPRING26. Offer ends July 31, 2026.
Aclara Resources Inc
ARA.TO
ARA.TO
Aclara Resources Inc
 WealthAwesome
Market cap
$917.27M
52W high
$5.40
52W low
$1.09
1W change
-2.83%
Beta
0.83
Analyst Price Targets
Based on analyst covering ARA
Wall Street analysts forecast ARA stock price to rise 32.3% over the next 12 months.
Consensus
BullishBased on avg. target vs last close (formal rating unavailable for Canadian listings)
Avg. Target
C$5.00
+32.3% Upside
Current Price
C$3.78
Last close
Analyst ratings and price targets are updated periodically. Not financial advice.
Wealth Awesome Price Forecast
WA ModelStatistical 90-day price range based on ARA's historical volatility
30-Day Vol
64.3%
Annualized
90-Day Vol
78.5%
Annualized
Trend (90d)
-13.1%
Annualized drift
90d Mean
C$3.61
Expected price
| Horizon | Expected | 68% Range (1σ) |
|---|---|---|
| 30 trading days | C$3.72 | C$2.98 – C$4.65 |
| 60 trading days | C$3.66 | C$2.68 – C$5.01 |
| 90 trading days | C$3.61 | C$2.46 – C$5.30 |
Methodology: Range is calculated using 30-day realized volatility via geometric Brownian motion (log-normal model). 68% band = ±1σ, 95% band = ±2σ. This is a statistical model, not a prediction. Past volatility does not guarantee future results. Not financial advice.
Investor takeaway: Investors should consider the recent performance of Aclara Resources Inc in the context of its ongoing projects and market sentiment, especially as the company navigates its growth strategies in the rare earth sector.
Aclara Resources Inc down 2.23% in one-day trading
The stock's price drop reflects a market capitalization of CA$991 million, suggesting a need for stronger performance to regain investor trust.
Bull case
Aclara has made progress in securing funding through private placements, which could help support its growth initiatives, including developing its rare earth separation technology.
Bear case
The recent decline in the stock highlights investor skepticism, especially since there hasn’t been any significant news to boost confidence in the company's future performance.
Market Reaction to Aclara's Performance
The recent drop in Aclara's stock price reflects a broader sentiment of caution among investors. With a market cap of CA$991 million, the decline signals a need for the company to strengthen its market position and rebuild investor confidence. Despite recent funding successes, the lack of fresh news may have contributed to this downturn.
Future Prospects and Investor Sentiment
Looking ahead, Aclara's ongoing projects, such as the rare earth separation pilot plant, could play a crucial role in shaping investor sentiment. However, without significant updates or progress, the stock may continue to face pressure. Investors are advised to keep an eye on upcoming developments and market trends that could influence Aclara's performance. For more details on Aclara's recent activities, check out our stock page.
Advertisement