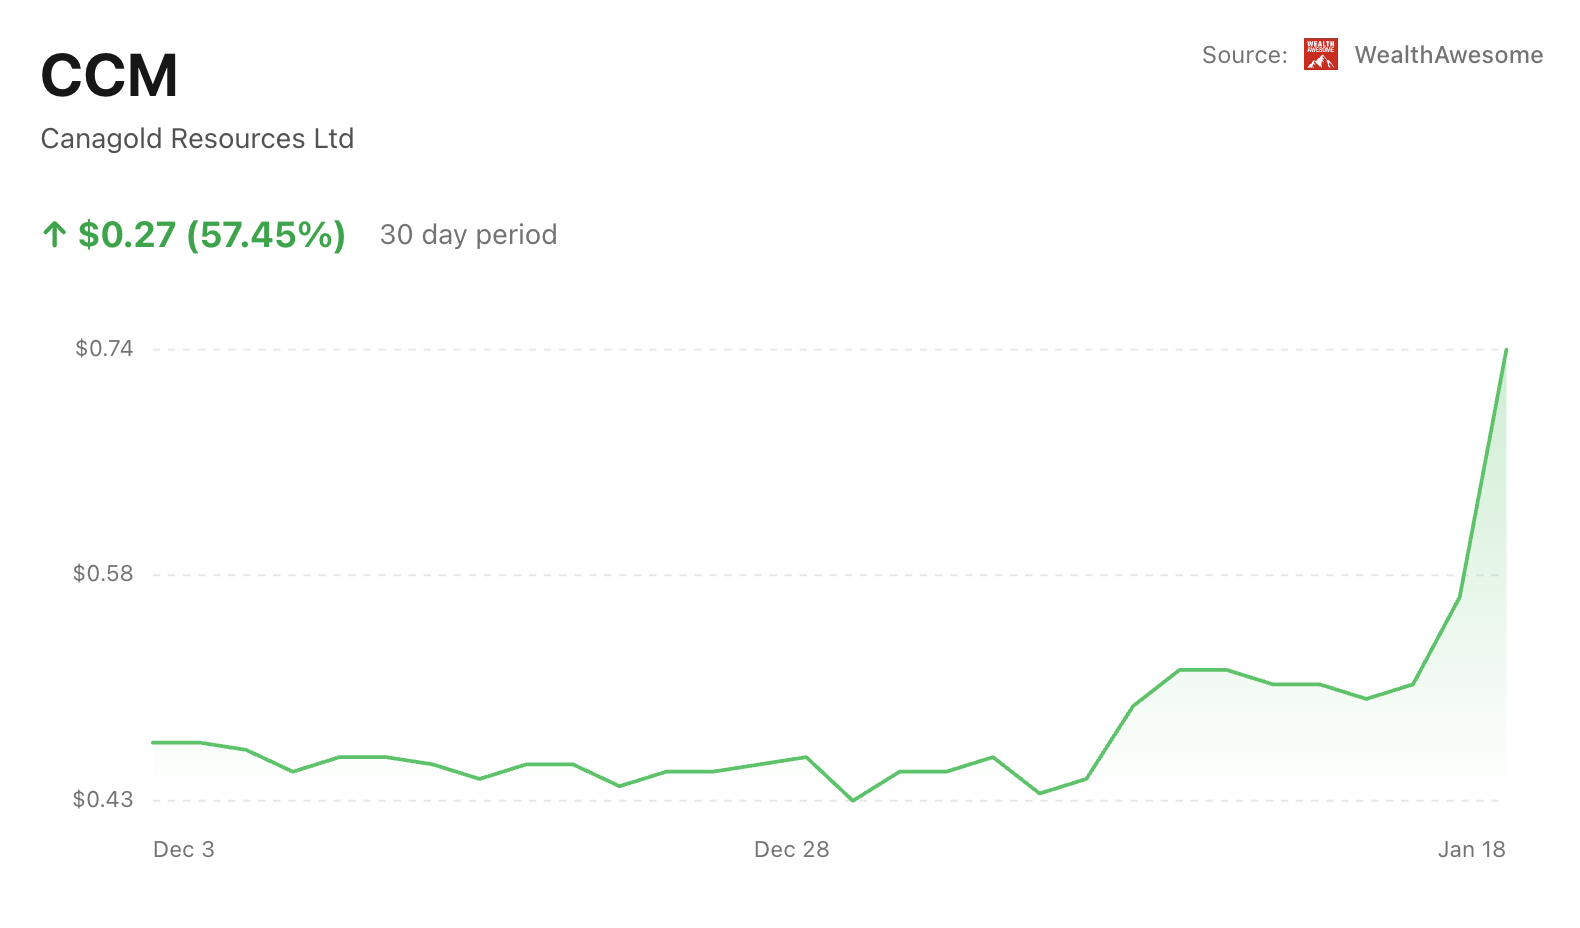
Canagold Resources’ TSX-listed shares extended their January surge on Jan. 18, pushing to the doorstep of a 52-week high as trading activity picked up sharply.
Over the past two weeks, CCM has posted a fast, stair-step run with volume expanding alongside the move—one reason the stock stood out even within the junior gold space.
The move
Advertisement

Get up to $2,000 cash back
Open and fund a new Qtrade account with promo code SPRING26. Offer ends July 31, 2026.
Canagold Resources Ltd
CCM.TO
CCM.TO
Canagold Resources Ltd
 WealthAwesome
Market cap
$109.11M
52W high
$0.79
52W low
$0.34
1W change
-1.89%
Beta
0.39
Analyst Price Targets
Based on analyst covering CCM
Wall Street analysts forecast CCM stock price to rise 130.3% over the next 12 months.
Consensus
BullishBased on avg. target vs last close (formal rating unavailable for Canadian listings)
Avg. Target
C$1.20
+130.3% Upside
Current Price
C$0.52
Last close
Analyst ratings and price targets are updated periodically. Not financial advice.
Wealth Awesome Price Forecast
WA ModelStatistical 90-day price range based on CCM's historical volatility
30-Day Vol
53.3%
Annualized
90-Day Vol
76.6%
Annualized
Trend (90d)
-38.6%
Annualized drift
90d Mean
C$0.45
Expected price
| Horizon | Expected | 68% Range (1σ) |
|---|---|---|
| 30 trading days | C$0.50 | C$0.41 – C$0.60 |
| 60 trading days | C$0.47 | C$0.37 – C$0.62 |
| 90 trading days | C$0.45 | C$0.33 – C$0.62 |
Methodology: Range is calculated using 30-day realized volatility via geometric Brownian motion (log-normal model). 68% band = ±1σ, 95% band = ±2σ. This is a statistical model, not a prediction. Past volatility does not guarantee future results. Not financial advice.
- On Jan. 18, 2026, Canagold Resources (CCM) closed at $0.74, up from $0.58, after trading as high as $0.79.
- Volume reached 431,800 shares, above recent sessions (including 131,315 on Jan. 15 and 16,675 on Jan. 14).
- Performance: +29.82% on the day, +45.10% over one week, and +64.44% over one month (last updated Jan. 18, 2026).
- The 52-week range is $0.28 to $0.79, and Friday’s high effectively tagged the top of that band.
Why traders noticed
This looked like a tape-driven move: a sub-dollar junior that’s easy to push around once buyers show up, with volume confirming that the bid was real rather than a single print.
Technically, CCM is now trading above its 50-day ($0.46) and 200-day ($0.43) moving averages. That’s the kind of trend break that tends to attract momentum screens—and it helps explain why the rally accelerated as the chart cleared common reference levels.
Fundamentals still reflect an exploration-stage profile. Canagold lists $0 in trailing twelve-month revenue, EBITDA of -$1.89M, and diluted EPS of -$0.01. The market cap is about $143.53M.
The anchor number
$0.74 — CCM’s Jan. 18 close, about $0.05 below the $0.79 52-week high and well above its longer-term moving averages.
What to watch from here
- Support check: Can CCM hold above the recent breakout zone (~$0.50–$0.57 from Jan. 13–15) without volume collapsing?
- Failure signal: A quick drop back below the $0.46 50-day moving average would suggest the spike was mostly liquidity-driven and already fading.
- Pressure point: A retest of $0.79 matters—breakouts that stick usually do it with steady volume, not a one-day blow-off.
Bottom line
CCM’s jump was driven by price/volume momentum into a near-52-week-high test, with the trend now clearly above key moving averages. The next couple of sessions matter because they’ll show whether Friday was a durable repricing—or just a fast run that stalls at the top of the range.
Advertisement