
Constellation Software’s slide has turned a steady Canadian compounder into one of the TSX’s most noticeable drawdowns in January.
This move matters because the market has been punishing expensive “quality growth” names. In that kind of tape, even resilient businesses can trade like crowded momentum positions rather than long-term fundamentals.
What just happened
Advertisement
Constellation Software Inc.
CSU.TO
CSU.TO
Constellation Software Inc.
 WealthAwesome
Market cap
$59.03B
P/E
43.9x
Div. yield
0.14%
Div. / share
$4.00
52W high
$4101.76
52W low
$2192.51
1W change
+0.62%
Beta
0.70
Analyst Price Targets
Based on analyst covering CSU · as of Sep 24, 2026
Wall Street analysts forecast CSU stock price to rise 41.0% over the next 12 months.
Consensus
BullishBased on avg. target vs last close (formal rating unavailable for Canadian listings)
Avg. Target
C$4013.72
+41.0% Upside
Previously C$3991.77 on Sep 23, 2026
Current Price
C$2846.12
Last close
Targets are snapshotted when they change. Unchanged figures keep their original date. Not financial advice.
Wealth Awesome Price Forecast
WA ModelStatistical 90-day price range based on CSU's historical volatility
30-Day Vol
34.9%
Annualized
90-Day Vol
45.9%
Annualized
Trend (90d)
+12.0%
Annualized drift
90d Mean
C$2970.93
Expected price
| Horizon | Expected | 68% Range (1σ) |
|---|---|---|
| 30 trading days | C$2887.13 | C$2559.52 – C$3256.67 |
| 60 trading days | C$2928.73 | C$2470.05 – C$3472.59 |
| 90 trading days | C$2970.93 | C$2411.53 – C$3660.09 |
Methodology: Range is calculated using 30-day realized volatility via geometric Brownian motion (log-normal model). 68% band = ±1σ, 95% band = ±2σ. This is a statistical model, not a prediction. Past volatility does not guarantee future results. Not financial advice.
Advertisement
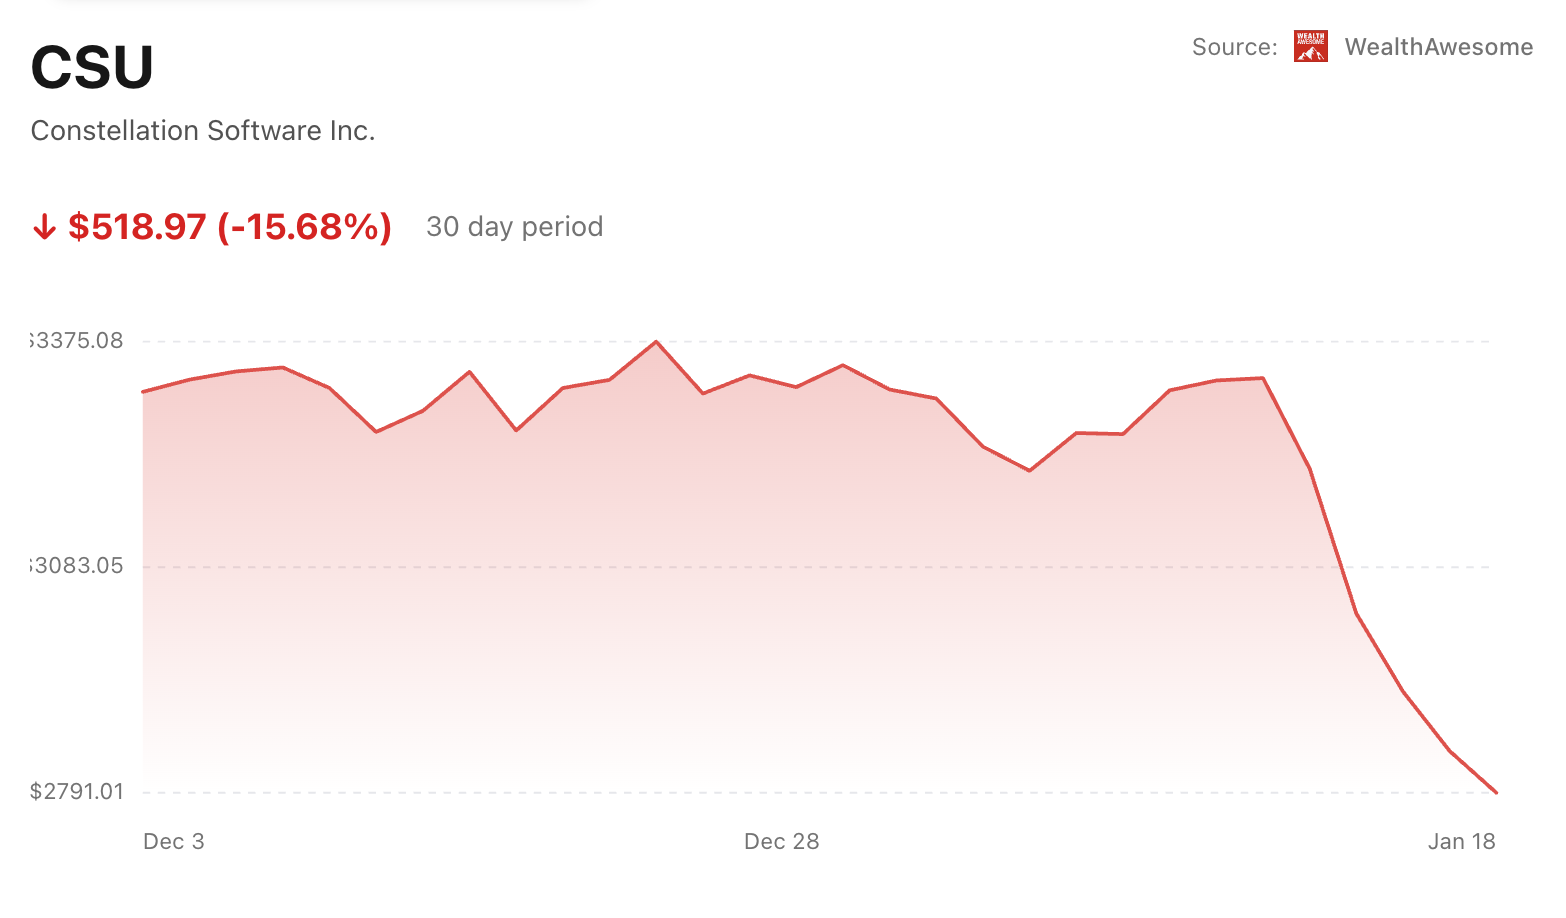
As of the prior trading day close (Jan. 19, 2026), Constellation Software (CSU) closed at $2,791.01, down 1.90% on the day.
Through that same close, CSU is down 16.13% this week and 17.31% over the past month.
The stock is now below its 50-day moving average ($3,277.31) and 200-day moving average ($4,238.89) — a break that often attracts more selling simply because so many investors and models track those levels.
Also on Jan. 19, the company disclosed a reset in the interest rate on its Series 1 debentures, setting the rate to 8.6% effective March 31, 2026, with the current 8.9% rate remaining until March 30.
Why the market cares
CSU is typically priced as a “high-quality” software roll-up: decentralized operators, frequent acquisitions, and a long record of compounding. In a risk-off market, that reputation can become a headwind because the stock is still valued for consistency.
On traditional metrics, there isn’t much cushion. Wealth Awesome lists CSU’s P/E at 62.11, which leaves the shares exposed when investors decide they want a higher return for the same earnings stream. This week’s drop looks more like a valuation reset than a sudden company-specific break.
Advertisement
The selling is being reinforced by the chart. Once CSU slipped under the 50-day and 200-day averages, it likely met automatic de-risking (rules-based funds, momentum screens, and managers reducing exposure after a trend break). That can make price action self-feeding for a stretch, even if the underlying business hasn’t visibly changed.
The debenture-rate update isn’t a clean catalyst on its own, but it lands at a moment when investors are jumpy about financing costs. For an acquisitive model, anything that drags “rates” back into the discussion can weigh on sentiment.
The key number
-16.13% — CSU’s weekly move in Wealth Awesome.
For a large-cap Canadian software name (market cap $59.15B), a drop this fast usually says more about positioning and risk appetite than about one incremental datapoint.
What happens next
- Watch for stabilization around recent lows. CSU is near its 52-week low of $2,665.41, a level where dip-buyers often show up if markets calm down.
- If the risk-off tone continues, the re-rating can keep going. A high-multiple name doesn’t need bad news to fall further when investors are shrinking exposure.
- The next real catalyst is results. The next reported quarter (March 6, 2026) is the clearest point where the narrative can shift back to growth, margins, and capital deployment.
Bottom line
This week’s decline looks like a re-rating and a technical break in a market that’s leaning defensive — not a sudden change in CSU’s operating story. Until the stock finds a floor and the broader tape steadies, the shares are likely to trade more like a high-multiple risk asset than the “steady compounder” investors are used to.
Best next step
Keep exploring this topic
If you want to go deeper, these are the most useful follow-up pages and tools for this topic.
Broker comparison
Best trading platforms in Canada
Compare $0-commission brokers before you act on a ticker story.
Safe cash
Best GIC rates in Canada
If the story makes you want to de-risk, compare guaranteed rates next.
HISA roundup
Best high-interest savings accounts
Keep dry powder in a no-fee savings account instead of chequing.
TFSA room
Check TFSA contribution room
Shelter the next contribution before you buy.
Advertisement

Qayyum Rajan, CFA
Qayyum is the CEO of Wealth Awesome, a leading Canadian personal finance publication. As a CFA charterholder with extensive experience in fintech, data science, and quantitative finance, he brings a unique analytical perspective to investing and wealth management.
View Full Profile →✅ Reviewed by Certified Financial Professionals
This content has been reviewed by CFA® charterholders and Certified Financial Planners (CFP®) with over a decade of experience in Canadian financial markets. All information is fact-checked against official Canadian sources and regulations.
Why these credentials matter: CFA® charterholders complete 900+ hours of rigorous study in investment analysis and ethics. CFP® professionals are held to the highest standards of financial planning competency and fiduciary duty in Canada.
⚠️ Professional Disclaimer
This content is for educational purposes only and should not be considered personalized financial advice. While our team brings professional expertise, individual circumstances vary. For personalized guidance, consult with a qualified financial advisor, tax professional, or mortgage specialist.