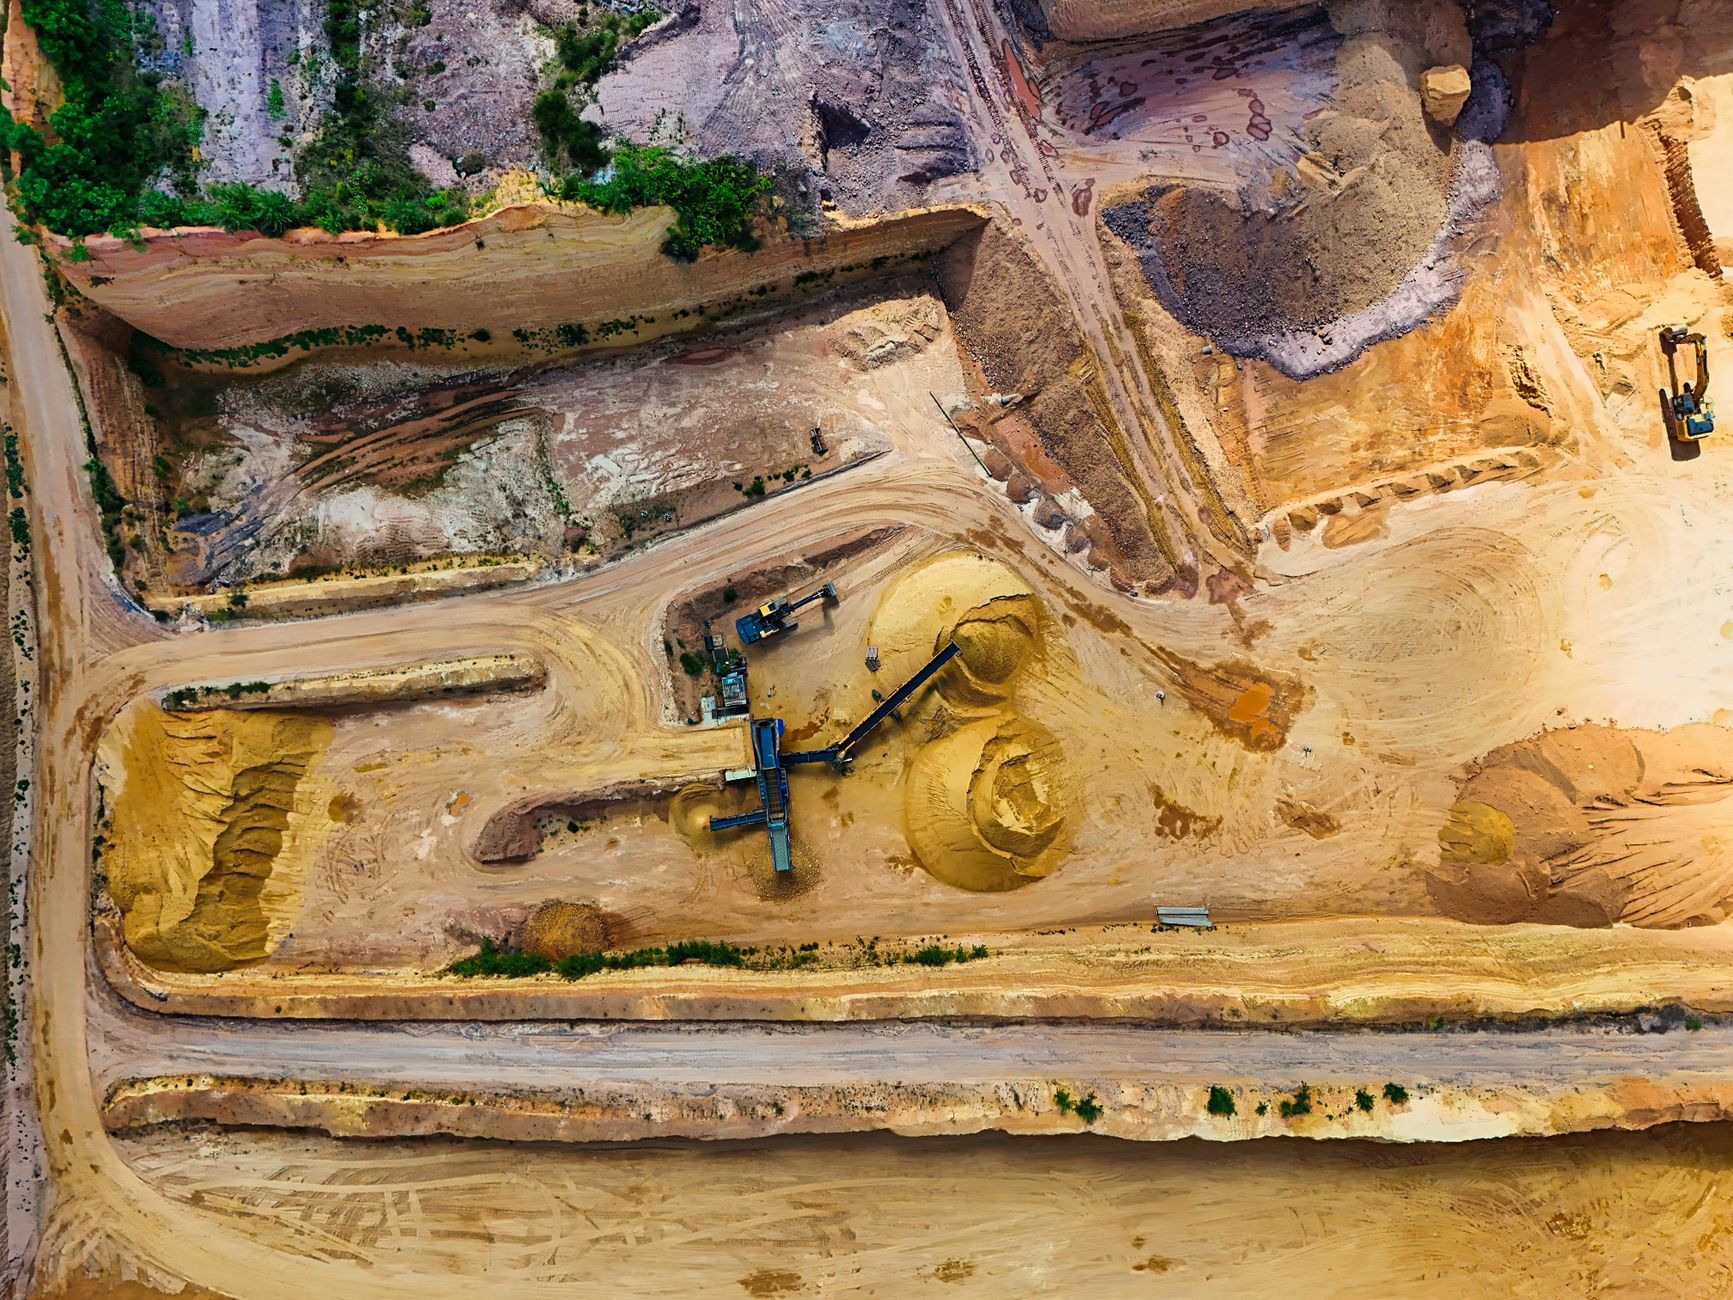
Golconda Gold Ltd. is making waves on the TSX Venture Exchange with a notable one-day gain of 7.41%.
In a robust trading session, Golconda Gold Ltd. (GG.V) saw its stock price surge by 7.41%, closing at CA$2.32. This impressive uptick is part of a broader trend of positive momentum for the company, which has been actively enhancing its operational and market presence in recent months.
Advertisement

Get up to $2,000 cash back
Open and fund a new Qtrade account with promo code SPRING26. Offer ends July 31, 2026.
Golconda Gold Ltd.
GG.V
GG.V
Golconda Gold Ltd.
 WealthAwesome
Market cap
$151.37M
P/E
8.2x
52W high
$4.18
52W low
$0.73
1W change
-10.22%
Beta
3.36
Analyst Price Targets
Based on analyst covering GG
Wall Street analysts forecast GG stock price to fall 68.3% over the next 12 months.
Consensus
BearishBased on avg. target vs last close (formal rating unavailable for Canadian listings)
Avg. Target
C$0.64
-68.3% Upside
Current Price
C$2.02
Last close
Analyst ratings and price targets are updated periodically. Not financial advice.
Wealth Awesome Price Forecast
WA ModelStatistical 90-day price range based on GG's historical volatility
30-Day Vol
73.6%
Annualized
90-Day Vol
81.2%
Annualized
Trend (90d)
-50.0%
Annualized drift
90d Mean
C$1.69
Expected price
| Horizon | Expected | 68% Range (1σ) |
|---|---|---|
| 30 trading days | C$1.90 | C$1.48 – C$2.45 |
| 60 trading days | C$1.79 | C$1.25 – C$2.57 |
| 90 trading days | C$1.69 | C$1.09 – C$2.62 |
Methodology: Range is calculated using 30-day realized volatility via geometric Brownian motion (log-normal model). 68% band = ±1σ, 95% band = ±2σ. This is a statistical model, not a prediction. Past volatility does not guarantee future results. Not financial advice.
Investor takeaway: Investors should take note of Golconda Gold's recent performance and strategic developments as potential indicators of future growth.
Golconda Gold Ltd. gains 7.41% in one trading day
The stock's market cap has reached CA$160.65 million, reflecting growing investor confidence.
Bull case
Golconda Gold has a P/E ratio of 8.65, which is favorable compared to many of its peers, indicating it might be undervalued. The recent appointments of new board members and record production figures show that the company is focused on growth and operational excellence.
Bear case
Despite today’s gains, the stock is still vulnerable to broader market fluctuations and the risks that come with mining, such as changes in commodity prices.
Recent Developments Fueling Growth
Golconda Gold Ltd. has been proactive in improving its corporate governance and operational efficiency. The recent appointments of Paul Olmsted and James Colter Eadie to the Board of Directors signal a commitment to strong leadership. Additionally, the company reported record quarterly production of 3,693 ounces of gold at the Galaxy Gold Mine, which boosts investor confidence even further.
Market Position and Valuation
With a market cap of CA$160.65 million and a P/E ratio of 8.65, Golconda Gold is competitively positioned in the mining sector. This valuation suggests that the stock may be undervalued compared to its peers, making it an attractive option for investors looking for growth opportunities in the resource sector.
Looking Ahead
As Golconda Gold continues to expand its market presence, investors should keep an eye on upcoming financial results and production reports. The company's recent achievements and strategic initiatives could pave the way for sustained growth, making it a stock to watch in the coming months.
Advertisement