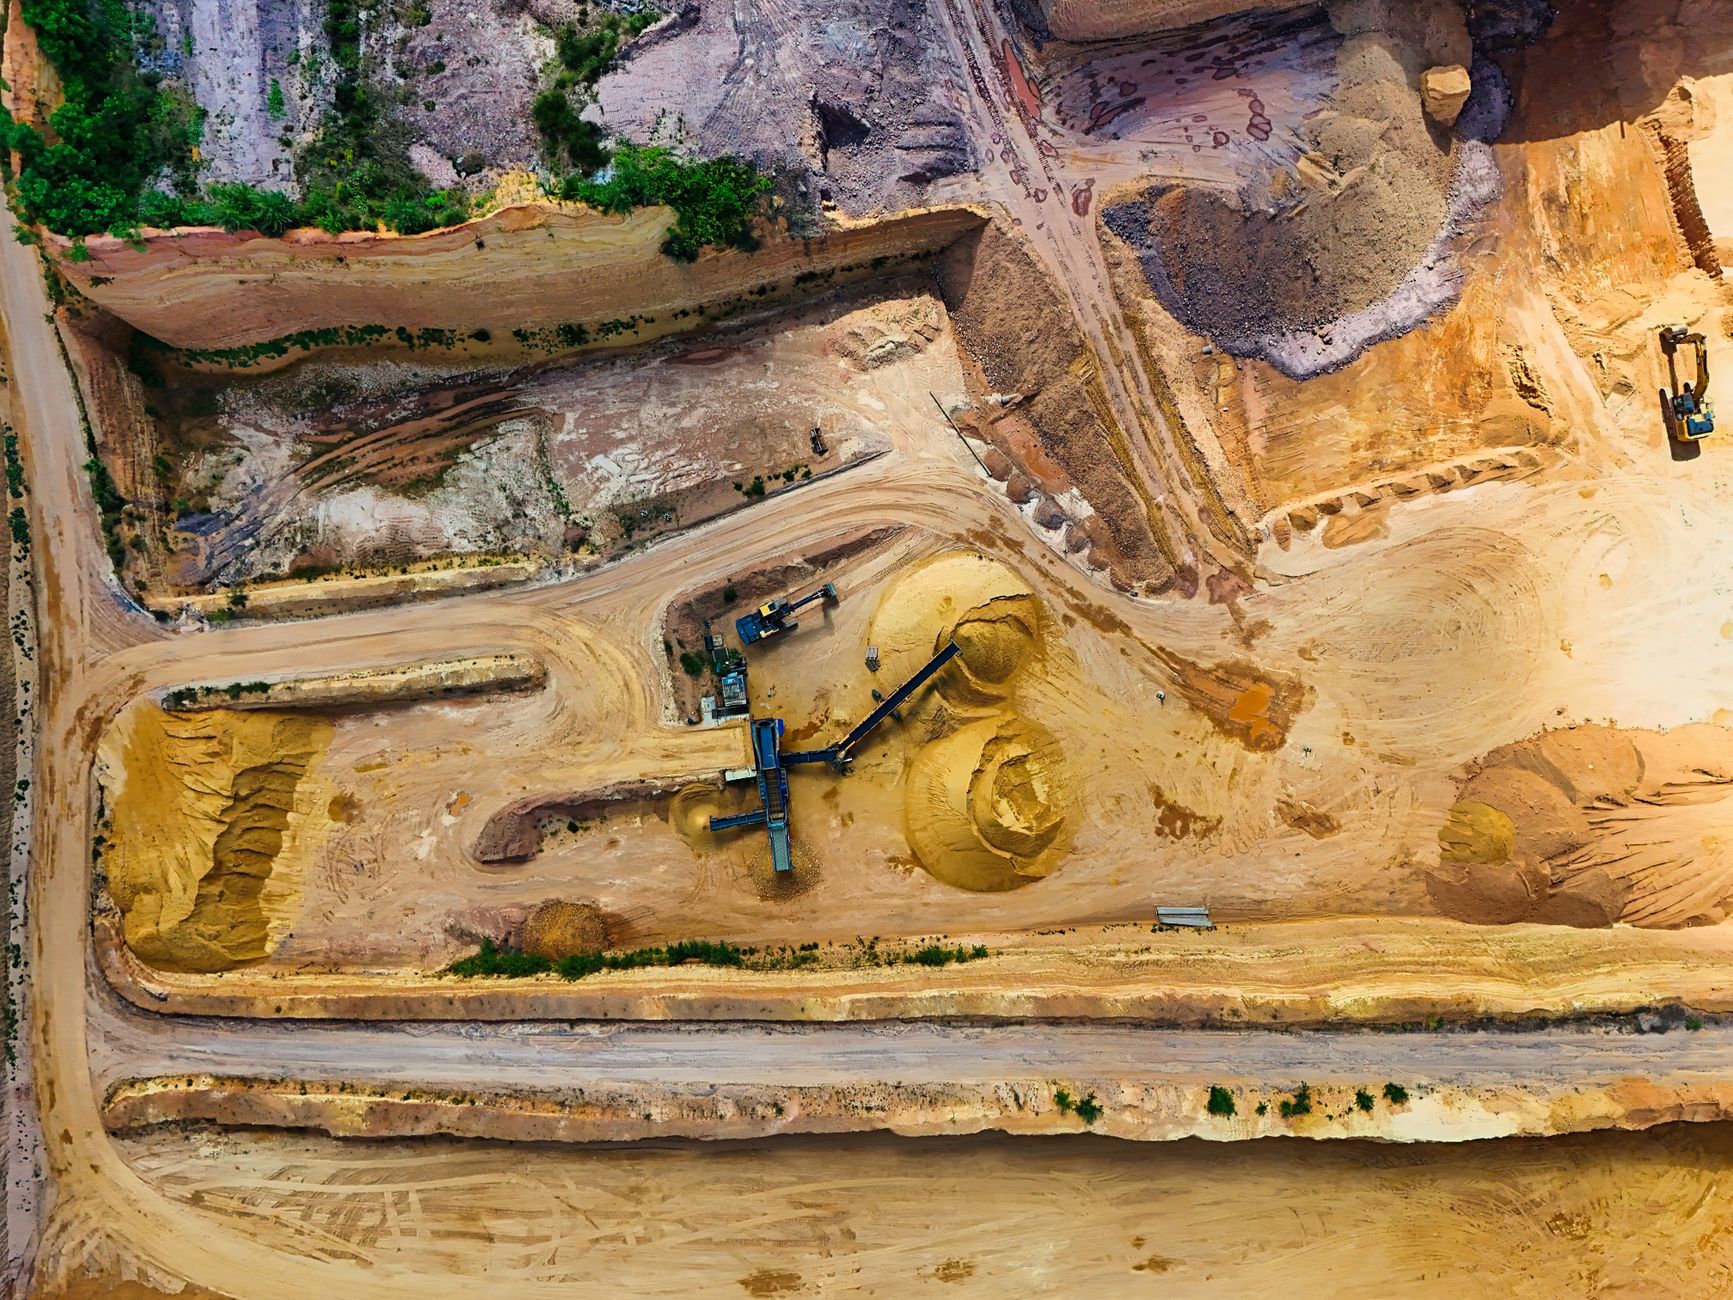
Mineros SA shares surged by 7.38% in the latest trading session, reflecting strong market sentiment and investor confidence.
In a remarkable display of market strength, Mineros SA (MSA.TO) saw its stock price increase by 7.38% during the last trading session, closing at CA$6.55. This positive movement shows the company's robust performance and growing investor interest.
Advertisement

Get up to $2,000 cash back
Open and fund a new Qtrade account with promo code SPRING26. Offer ends July 31, 2026.
Mineros SA
MSA.TO
MSA.TO
Mineros SA
 WealthAwesome
Market cap
$1.85B
P/E
6.8x
52W high
$7.79
52W low
$2.41
1W change
+0.16%
Beta
1.23
Analyst Price Targets
Based on analyst covering MSA
Wall Street analysts forecast MSA stock price to rise 74.4% over the next 12 months.
Consensus
BullishBased on avg. target vs last close (formal rating unavailable for Canadian listings)
Avg. Target
C$10.97
+74.4% Upside
Current Price
C$6.29
Last close
Analyst ratings and price targets are updated periodically. Not financial advice.
Wealth Awesome Price Forecast
WA ModelStatistical 90-day price range based on MSA's historical volatility
30-Day Vol
73.1%
Annualized
90-Day Vol
63.4%
Annualized
Trend (90d)
+50.0%
Annualized drift
90d Mean
C$7.52
Expected price
| Horizon | Expected | 68% Range (1σ) |
|---|---|---|
| 30 trading days | C$6.68 | C$5.19 – C$8.59 |
| 60 trading days | C$7.09 | C$4.96 – C$10.12 |
| 90 trading days | C$7.52 | C$4.86 – C$11.64 |
Methodology: Range is calculated using 30-day realized volatility via geometric Brownian motion (log-normal model). 68% band = ±1σ, 95% band = ±2σ. This is a statistical model, not a prediction. Past volatility does not guarantee future results. Not financial advice.
Investor takeaway: The recent surge in Mineros SA's stock price highlights the potential for growth in the mining sector, particularly for companies with strong fundamentals and positive market sentiment.
Mineros SA Stock Rises 7.38% in One Day
With a market cap of CA$1.98 billion, Mineros SA's strong performance reflects its solid financial health and investor confidence.
Bull case
Mineros SA's strong financial results, including a low P/E ratio of 7.35 and a solid profit margin of 20.91%, position it well for continued growth, especially as gold prices remain favorable. Investors are seeing the value in Mineros, which suggests it could be a good opportunity, especially with gold demand on the rise.
Bear case
Despite the recent gains, investors should stay cautious. Market volatility can impact mining stocks, and any downturn in gold prices could affect Mineros' profitability. It's important to keep an eye on these factors before making investment decisions.
Understanding Mineros SA's Performance
Mineros SA's latest stock surge can be attributed to its strong financial performance, highlighted by a P/E ratio of 7.35 and a profit margin of 20.91%. These metrics suggest that the company is not only profitable but also undervalued compared to its peers in the mining sector. Investors are increasingly recognizing the potential for growth, particularly as global demand for gold remains strong.
Market Sentiment and Future Outlook
The positive movement in Mineros SA's stock also reflects broader market trends favoring mining stocks. As the company enhances its operations and expands its market reach, especially with its recent DTC eligibility announcement, investor confidence is likely to remain high. However, potential investors should keep an eye on gold price fluctuations, which could impact future performance. For more insights, visit our detailed analysis on Mineros SA.
Advertisement