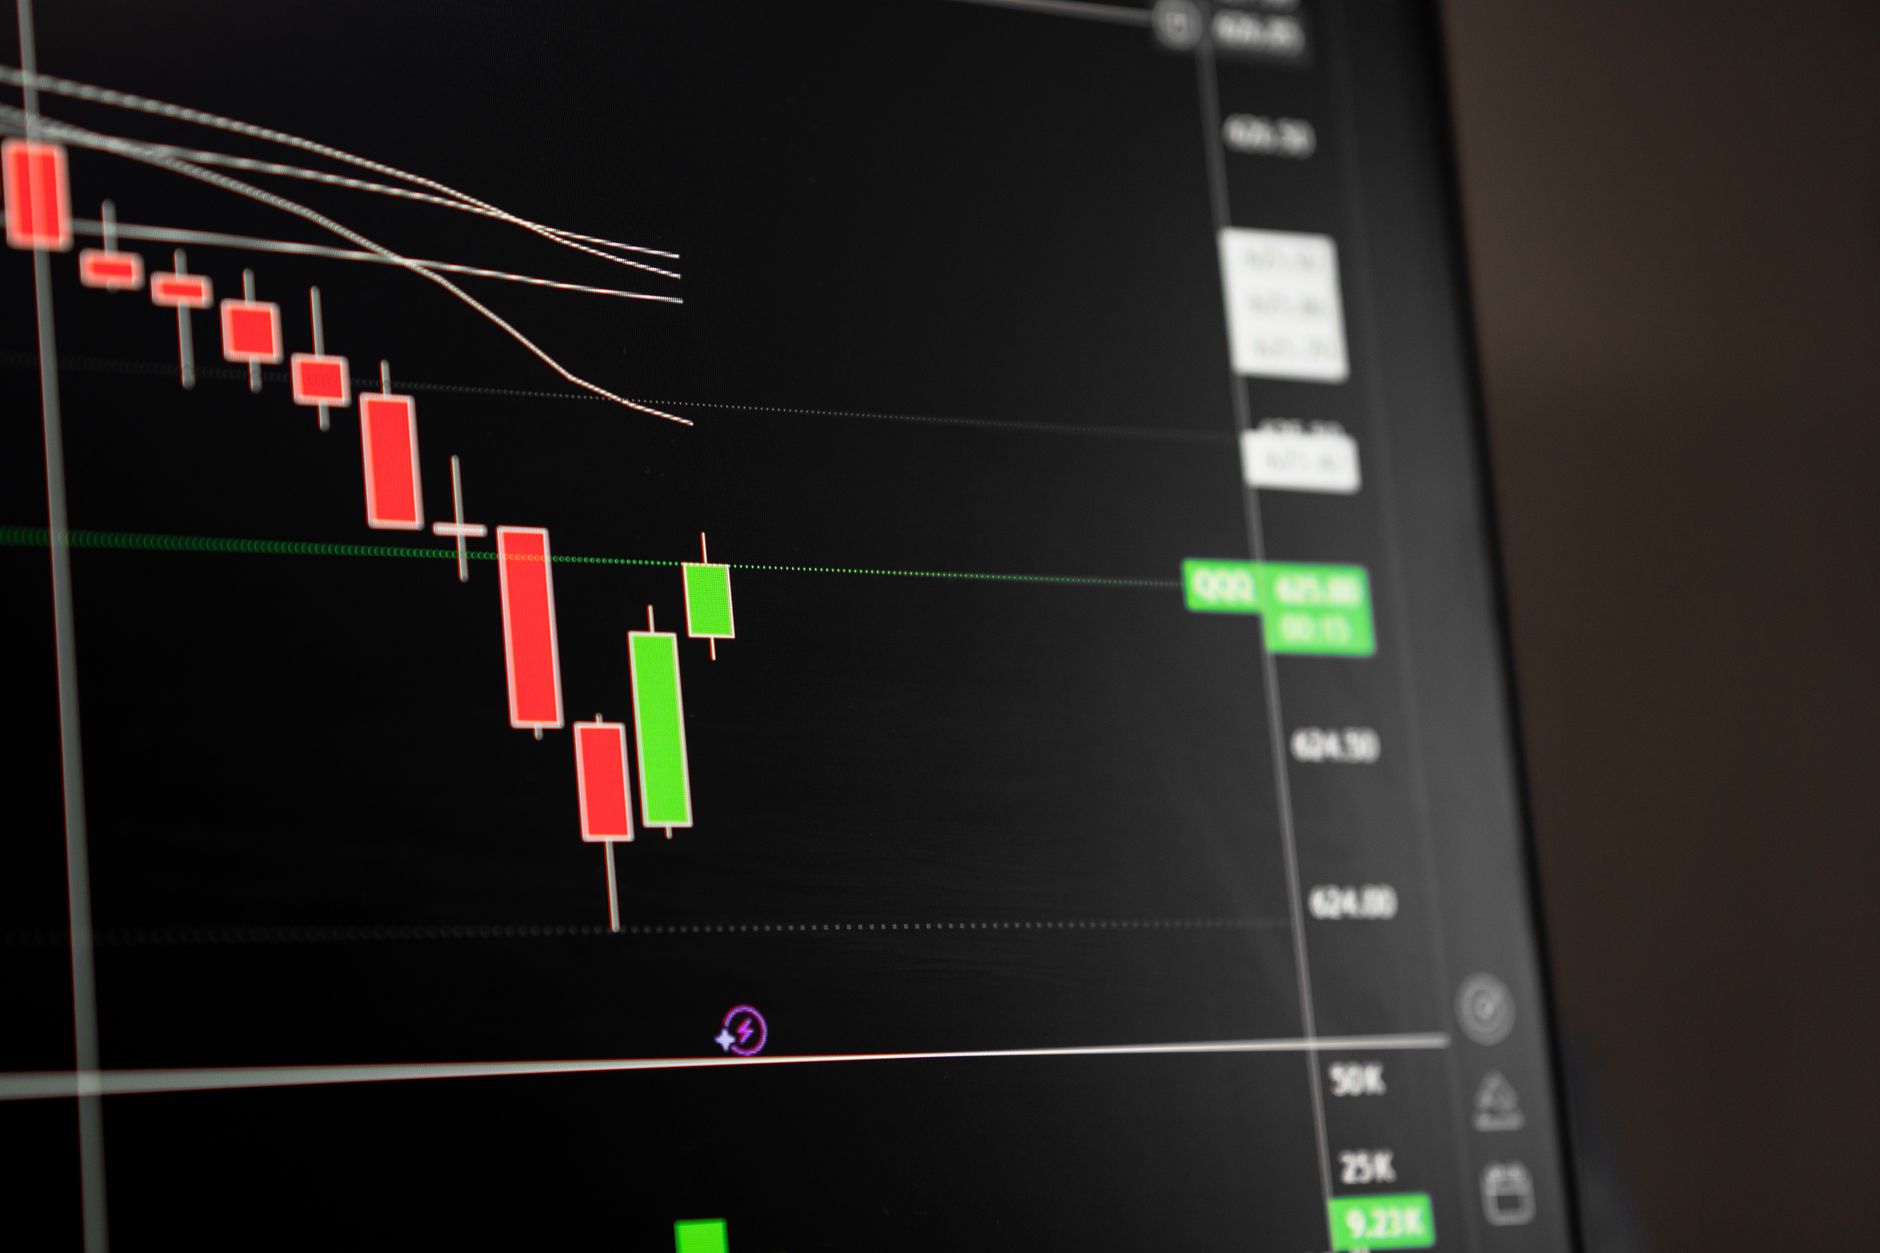
Saturn Oil & Gas Inc. is making waves on the TSX with a notable 5.43% surge in share price, closing at CA$5.82.
In a strong showing on the TSX, Saturn Oil & Gas Inc. (SOIL.TO) has seen its stock price jump by 5.43% in the last trading session. This rise reflects positive market sentiment and investor confidence in the company’s strategies and financial health.
Advertisement

Get up to $2,000 cash back
Open and fund a new Qtrade account with promo code SPRING26. Offer ends July 31, 2026.
Saturn Oil & Gas Inc.
SOIL.TO
SOIL.TO
Saturn Oil & Gas Inc.
 WealthAwesome
Market cap
$1.00B
P/E
55.2x
52W high
$7.69
52W low
$2.10
1W change
+11.49%
Beta
0.41
Analyst Price Targets
Based on analyst covering SOIL
Wall Street analysts forecast SOIL stock price to rise 41.1% over the next 12 months.
Consensus
No RatingAvg. Target
C$8.21
+41.1% Upside
Current Price
C$5.82
Last close
Analyst ratings and price targets are updated periodically. Not financial advice.
Wealth Awesome Price Forecast
WA ModelStatistical 90-day price range based on SOIL's historical volatility
30-Day Vol
59.9%
Annualized
90-Day Vol
71.3%
Annualized
Trend (90d)
+11.7%
Annualized drift
90d Mean
C$6.07
Expected price
| Horizon | Expected | 68% Range (1σ) |
|---|---|---|
| 30 trading days | C$5.90 | C$4.80 – C$7.26 |
| 60 trading days | C$5.98 | C$4.47 – C$8.01 |
| 90 trading days | C$6.07 | C$4.24 – C$8.68 |
Methodology: Range is calculated using 30-day realized volatility via geometric Brownian motion (log-normal model). 68% band = ±1σ, 95% band = ±2σ. This is a statistical model, not a prediction. Past volatility does not guarantee future results. Not financial advice.
Investor takeaway: With a market cap exceeding CA$1 billion and a recent increase in share price, Saturn Oil & Gas Inc. is establishing itself as a key player in the oil and gas sector, especially as it manages its financial commitments and production goals.
5.43% Surge in Share Price
Saturn Oil & Gas Inc. closed at CA$5.82, marking a significant gain that shows investor optimism and strategic financial moves.
Bull case
The recent extension and increase of Saturn's credit facility gives the company more financial flexibility. This could help it take advantage of growth opportunities and increase shareholder value.
Bear case
Despite the positive movement, Saturn's high P/E ratio of 58.2 raises concerns that the stock might be overvalued. If earnings don’t meet expectations, it could lead to volatility in the stock price.
Market Performance Overview
Saturn Oil & Gas Inc. closed the last trading session at CA$5.82, reflecting a robust 5.43% increase. This performance indicates a strong investor response, likely driven by recent financial developments and positive market sentiment.
Financial Flexibility and Growth Potential
The company's recent announcement about extending and increasing its credit facility to CA$200 million enhances its financial flexibility. With a total borrowing base of up to CA$500 million, Saturn is well-positioned to pursue growth opportunities, which may further boost investor confidence.
Valuation Considerations
While the recent stock performance is promising, investors should be cautious of Saturn's high P/E ratio of 58.2. This suggests that the stock may be overvalued, and any future earnings disappointments could lead to significant price corrections.
Advertisement