
Why Verizon CDR Shares Jumped 11% Yesterday
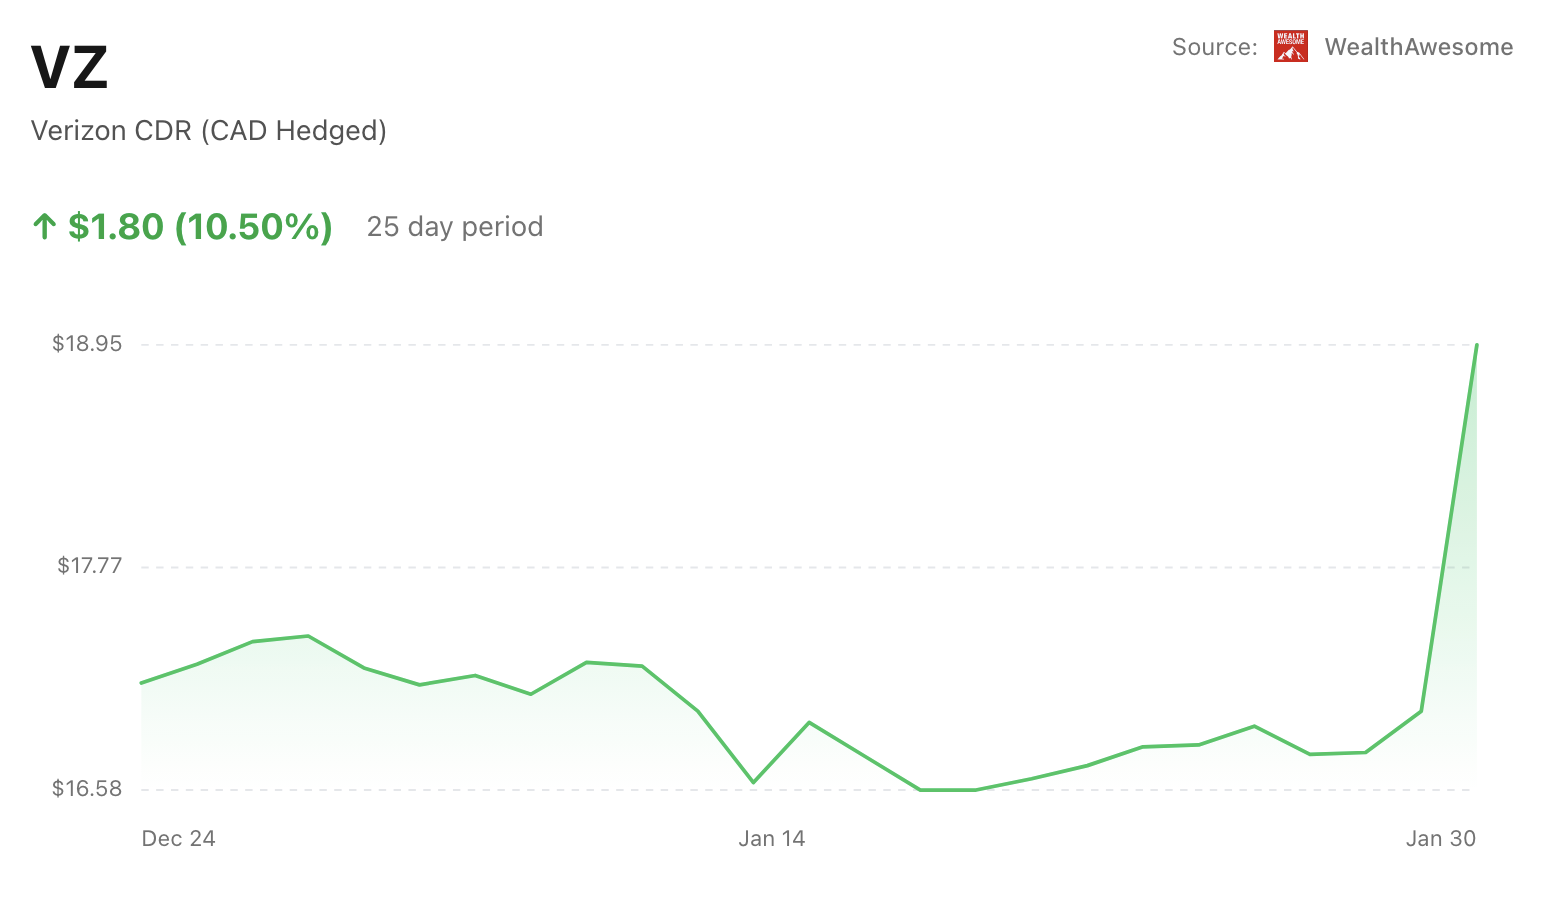
Verizon’s Canadian-listed CDR surged Friday as investors rotated into yield-oriented names amid thin late-January trading, rather than in response to any new company-specific development.
Why this move stood out
Advertisement
Verizon CDR (CAD Hedged)
VZ.TO
VZ.TO
Verizon CDR (CAD Hedged)
 WealthAwesome
Market cap
$189.86B
P/E
11.7x
Div. yield
15.03%
Div. / share
$2.79
52W high
$21.31
52W low
$15.21
1W change
+7.57%
Wealth Awesome Price Forecast
WA ModelStatistical 90-day price range based on VZ's historical volatility
30-Day Vol
39.9%
Annualized
90-Day Vol
31.7%
Annualized
Trend (90d)
+6.8%
Annualized drift
90d Mean
C$19.21
Expected price
| Horizon | Expected | 68% Range (1σ) |
|---|---|---|
| 30 trading days | C$18.90 | C$16.47 – C$21.69 |
| 60 trading days | C$19.05 | C$15.68 – C$23.15 |
| 90 trading days | C$19.21 | C$15.13 – C$24.38 |
Methodology: Range is calculated using 30-day realized volatility via geometric Brownian motion (log-normal model). 68% band = ±1σ, 95% band = ±2σ. This is a statistical model, not a prediction. Past volatility does not guarantee future results. Not financial advice.
Advertisement
Late January trading on the TSX has been marked by sharp moves in rate-sensitive and income-focused securities, particularly where liquidity is limited. With bond yields shifting and the Canadian dollar remaining volatile, Canadian-listed CDRs tied to large U.S. dividend payers have become more reactive than usual.
What actually happened
- Verizon CDR (CAD Hedged) jumped 11.47% on Jan. 30, closing at $18.95 — a new 52-week high.
- Volume climbed to roughly 115,700 shares, well above recent norms.
- The gain extended a 12.7% move over the past week and nearly 10% year-to-date.
- There were no earnings updates, guidance changes, or corporate announcements from Verizon.
What’s driving it
The size of the move reflects positioning more than fundamentals. The Verizon CDR offers Canadian investors access to a high-dividend U.S. telecom while neutralizing currency swings — a combination that has regained appeal as investors rebalance income exposure early in the year.
Advertisement
Because CDRs trade with lighter liquidity than U.S.-listed shares, sudden bursts of demand can translate into outsized single-day price moves. Friday’s spike fits that pattern, especially in a week dominated by dividend rotation rather than stock-specific news.
There’s also a relative value angle at play. Canadian telecom stocks have faced sustained pressure from pricing competition and regulatory scrutiny, pushing some income investors toward U.S. alternatives. While Verizon’s underlying business remains slow-growing, its cash flow visibility and dividend stability continue to stand out in a rate-uncertain environment.
The key number
+11.47% — the one-day gain that pushed Verizon CDR to a fresh 52-week high on the TSX.
Bottom line
Friday’s surge in Verizon’s Canadian-listed CDR wasn’t about new information — it was about structure, liquidity, and timing. In a market dominated by yield rotations and early-year repositioning, even defensive, slow-moving names can see abrupt price dislocations on the TSX when demand concentrates quickly.
Best next step
Keep exploring this topic
If you want to go deeper, these are the most useful follow-up pages and tools for this topic.
Broker comparison
Best trading platforms in Canada
Compare $0-commission brokers before you act on a ticker story.
Safe cash
Best GIC rates in Canada
If the story makes you want to de-risk, compare guaranteed rates next.
HISA roundup
Best high-interest savings accounts
Keep dry powder in a no-fee savings account instead of chequing.
TFSA room
Check TFSA contribution room
Shelter the next contribution before you buy.
Advertisement

Qayyum Rajan, CFA
Qayyum is the CEO of Wealth Awesome, a leading Canadian personal finance publication. As a CFA charterholder with extensive experience in fintech, data science, and quantitative finance, he brings a unique analytical perspective to investing and wealth management.
View Full Profile →✅ Reviewed by Certified Financial Professionals
This content has been reviewed by CFA® charterholders and Certified Financial Planners (CFP®) with over a decade of experience in Canadian financial markets. All information is fact-checked against official Canadian sources and regulations.
Why these credentials matter: CFA® charterholders complete 900+ hours of rigorous study in investment analysis and ethics. CFP® professionals are held to the highest standards of financial planning competency and fiduciary duty in Canada.
⚠️ Professional Disclaimer
This content is for educational purposes only and should not be considered personalized financial advice. While our team brings professional expertise, individual circumstances vary. For personalized guidance, consult with a qualified financial advisor, tax professional, or mortgage specialist.