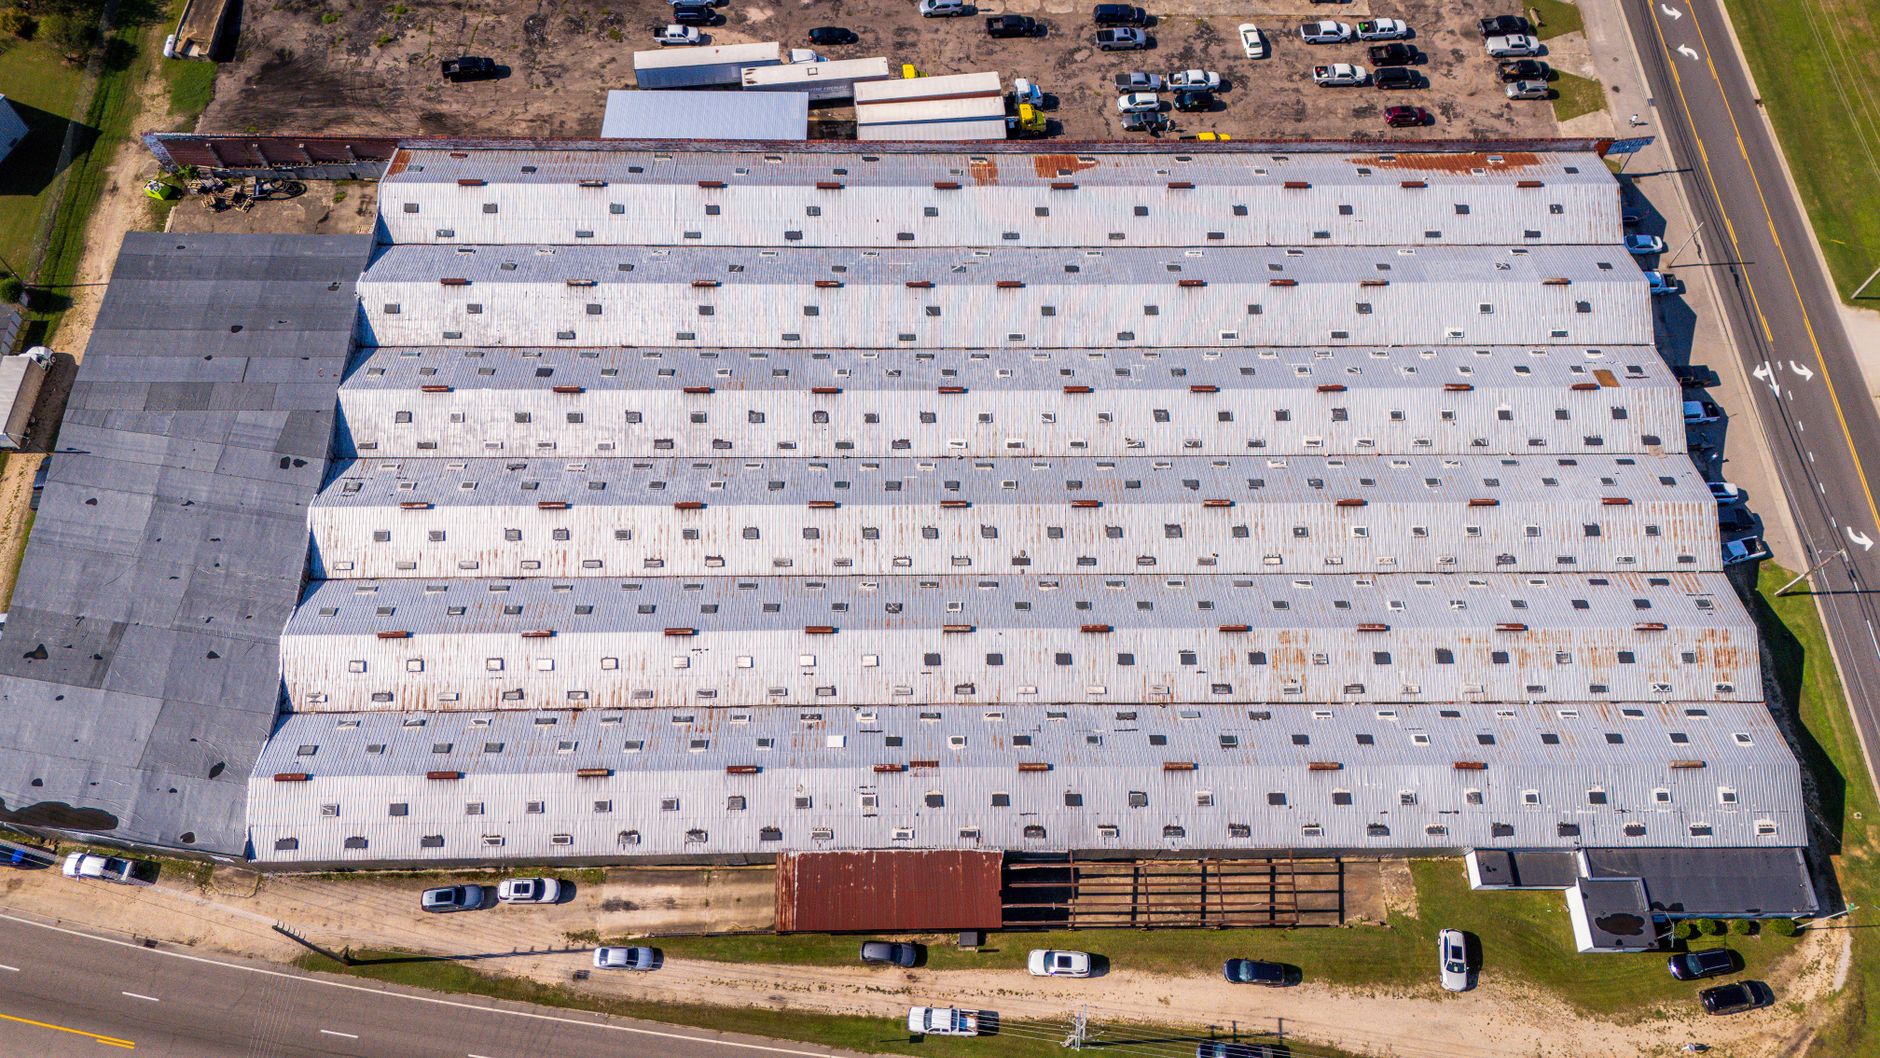
BTB REIT’s third-quarter results reflect the strain from vacancies and lower property income. Leasing gains and a shift toward industrial properties offer some support, but haven’t yet reversed the declines.
BTB Real Estate Investment Trust (TSX: BTB-UN) reported earnings after markets closed on November 10, 2026, for the quarter ended September 30. Calendar data lists EPS of C$0.1205, but provides no estimate for comparison, so it’s not possible to say whether earnings beat or missed expectations. The operating results are clearer: rental revenue and net operating income fell year over year, and occupancy was 90.7%.
Recent earnings trend
BTB Real Estate Investment Trust
BTB-UN.TO
BTB-UN.TO
BTB Real Estate Investment Trust
 WealthAwesome
Market cap
$319.35M
P/E
11.9x
Div. yield
8.43%
Div. / share
$0.30
52W high
$4.06
52W low
$3.36
1W change
+0.57%
Beta
0.79
Analyst Price Targets
Based on analyst covering BTB-UN · as of Nov 18, 2026
Wall Street analysts forecast BTB-UN stock price to rise 4.3% over the next 12 months.
Consensus
NeutralBased on avg. target vs last close (formal rating unavailable for Canadian listings)
Avg. Target
C$3.65
+4.3% Upside
Previously C$3.84 on Oct 28, 2026
Current Price
C$3.50
Last close
Targets are snapshotted when they change. Unchanged figures keep their original date. Not financial advice.
Wealth Awesome Price Forecast
WA ModelStatistical 90-day price range based on BTB-UN's historical volatility
30-Day Vol
23.2%
Annualized
90-Day Vol
16.6%
Annualized
Trend (90d)
-42.2%
Annualized drift
90d Mean
C$3.01
Expected price
| Horizon | Expected | 68% Range (1σ) |
|---|---|---|
| 30 trading days | C$3.33 | C$3.07 – C$3.61 |
| 60 trading days | C$3.17 | C$2.83 – C$3.55 |
| 90 trading days | C$3.01 | C$2.62 – C$3.46 |
Methodology: Range is calculated using 30-day realized volatility via geometric Brownian motion (log-normal model). 68% band = ±1σ, 95% band = ±2σ. This is a statistical model, not a prediction. Past volatility does not guarantee future results. Not financial advice.
Analyst coverage: 1 analyst(s) cover this name; upcoming EPS consensus is available.
| Fiscal period | Report date | Actual EPS | Estimate | Surprise |
|---|---|---|---|---|
| 2026-09-30 | 2026-11-10 | 0.1205 | — | — |
| 2026-06-30 | 2026-08-11 | 0.0984 | — | — |
| 2026-03-31 | 2026-05-12 | 0.0940 | — | — |
| 2025-12-31 | 2026-02-24 | -0.0105 | — | — |
| 2025-09-30 | 2025-11-03 | 0.1068 | — | — |
| 2025-06-30 | 2025-08-04 | 0.0696 | — | — |
For Canadian investors, the main questions are whether BTB can lease its vacant space, manage upcoming mortgage renewals and maintain its distribution as it shifts more of its portfolio toward industrial properties.
Investor takeaway: Vacancies and weaker property income weighed on the quarter. Comparisons were also affected by lease-cancellation penalties received in Q3 2025. Leasing activity and rent increases on renewals are encouraging, but haven’t offset the declines. BTB kept its quarterly distribution at C$0.075 per unit. Investors should weigh that income against refinancing costs, occupancy and the pace of leasing.
90.7% occupancy
Occupancy was slightly lower than a year earlier. Leasing vacant properties is key to restoring property income, particularly as BTB works to fill space in Ottawa and other markets.
Bull case
BTB leased or renewed 188,000 square feet in the quarter and 772,000 square feet year to date. Renewals brought an average rent increase of 6.6% in Q3, including 11% for suburban office leases. The trust is also shifting toward industrial properties, which made up 38% of its portfolio. It reported a stable investment-property value of C$1.2 billion. Management said federal tenants have shown interest in vacant Ottawa office space, though it’s unclear how long leasing will take.
Bear case
Rental revenue fell 4.2% year over year to C$31.5 million. Net operating income (NOI) declined 10.1%, and cash NOI fell 6.3%. Cash same-property NOI was down 7% for the quarter. With occupancy at 90.7%, BTB still has significant space to lease. Adjusted funds from operations (FFO) were C$0.093 per unit, and adjusted adjusted funds from operations (AFFO) were C$0.088 per unit, both below year-earlier levels. Refinancing could add pressure: the weighted-average mortgage rate was 4.47%, and management cited nearly C$80 million in mortgage maturities in Q4 2026.
Earnings and distribution
Calendar data lists EPS of C$0.1205, but includes no estimate for the quarter. The result can’t be described as a beat or miss.
Rental revenue was C$31.5 million, down 4.2% year over year. NOI fell 10.1%, and cash NOI declined 6.3%. The prior-year quarter included a lease-cancellation penalty. Excluding that item, rental revenue was down 0.9%, NOI fell 4.8% and cash NOI declined 0.9%, according to BTB’s reported figures.
Cash same-property NOI fell 7% in the quarter and 5.9% over the first nine months. Excluding 2025 lease-cancellation penalties, the declines were 1.3% and 2.3%. Adjusted FFO was C$0.093 per unit and adjusted AFFO was C$0.088 per unit, down C$0.022 and C$0.013, respectively, from a year earlier.
BTB maintained its quarterly distribution at C$0.075 per unit, or C$0.30 annualized. The recent earnings trend table provides historical context, but comparable-quarter estimate data is limited.
Leasing and portfolio
BTB leased or renewed 188,000 square feet in Q3 and 772,000 square feet year to date. Average rent increases on renewals were 6.6% for the quarter: 5.7% for industrial properties, 11% for suburban offices and 5% for necessity-based retail.
Occupancy was 90.7%, slightly below Q3 2025. Management said demand for Ottawa office space has started to improve, including interest from federal tenants in the vacant Walkley property. It expects leasing there to take time.
The portfolio includes 72 properties and 5.9 million square feet. Industrial properties account for 38% of the portfolio and offices for 39%. BTB completed three acquisitions in 2026 worth C$58 million, which are expected to add C$4.2 million in annualized NOI. Four office-property sales reduced NOI by C$3.6 million. Property values were stable at C$1.2 billion, with a C$3 million appraisal gain. See the BTB-UN stock page for company information and market data.
Debt and analyst data
BTB’s total debt ratio was 57.4%, and its mortgage debt ratio was 50.9%. Both were down 40 basis points since year-end. The weighted-average mortgage rate was 4.47%, up eight basis points from a year earlier.
Management flagged nearly C$80 million in mortgage maturities across six properties in Q4 2026, with more maturities in 2027. Refinancing at higher rates could reduce cash flow. Reported liquidity was C$16.5 million, including C$1.4 million in cash and C$15.1 million available through credit facilities.
The supplied analyst-target data shows an average target of C$3.65, compared with a last close of C$3.50, a 4.3% difference. The Neutral label reflects the target-price comparison, not a formal analyst rating. See analyst targets.
Wealth Awesome’s statistical 90-day price model gives a mean forecast of C$3.01. Its 68% range is C$2.62–C$3.46, and its 95% range is C$2.28–C$3.97. This is a statistical model, not financial advice or a price target. Review the model forecast alongside your own research.
Best next step
Keep exploring this topic
If you want to go deeper, these are the most useful follow-up pages and tools for this topic.
Broker comparison
Best trading platforms in Canada
Compare $0-commission brokers before you act on a ticker story.
Safe cash
Best GIC rates in Canada
If the story makes you want to de-risk, compare guaranteed rates next.
HISA roundup
Best high-interest savings accounts
Keep dry powder in a no-fee savings account instead of chequing.
TFSA room
Check TFSA contribution room
Shelter the next contribution before you buy.

Wealth Awesome
Timely coverage of Canadian stocks, earnings, dividends, and market movers for DIY investors. Stories are checked against exchange data and public filings.
View Full Profile →✅ Reviewed by Certified Financial Professionals
This content has been reviewed by CFA® charterholders and Certified Financial Planners (CFP®) with over a decade of experience in Canadian financial markets. All information is fact-checked against official Canadian sources and regulations.
Why these credentials matter: CFA® charterholders complete 900+ hours of rigorous study in investment analysis and ethics. CFP® professionals are held to the highest standards of financial planning competency and fiduciary duty in Canada.
⚠️ Professional Disclaimer
This content is for educational purposes only and should not be considered personalized financial advice. While our team brings professional expertise, individual circumstances vary. For personalized guidance, consult with a qualified financial advisor, tax professional, or mortgage specialist.