
New Gold Inc. Surged Nearly 12% — Here’s What Investors Are Watching
Shares of New Gold Inc. surged on Thursday, making the stock one of the strongest performers on the TSX despite no new company announcement.
That kind of move matters in the current market. Investors have been quick to reward momentum and sector exposure, even in the absence of fresh headlines, particularly within materials and precious metals.
Advertisement
New Gold Inc
NGD.TO
NGD.TO
New Gold Inc
 WealthAwesome
Market cap
$9.63B
P/E
27.0x
52W high
$18.62
52W low
$4.12
1W change
+0.00%
Beta
1.83
Analyst Price Targets
Based on analyst covering NGD · as of Sep 17, 2026
Wall Street analysts forecast NGD stock price to fall 61.2% over the next 12 months.
Consensus
BearishBased on avg. target vs last close (formal rating unavailable for Canadian listings)
Avg. Target
C$4.72
-61.2% Upside
Current Price
C$12.16
Last close
Targets are snapshotted when they change. Unchanged figures keep their original date. Not financial advice.
Wealth Awesome Price Forecast
WA ModelStatistical 90-day price range based on NGD's historical volatility
30-Day Vol
87.5%
Annualized
90-Day Vol
75.7%
Annualized
Trend (90d)
-15.3%
Annualized drift
90d Mean
C$11.51
Expected price
| Horizon | Expected | 68% Range (1σ) |
|---|---|---|
| 30 trading days | C$11.94 | C$8.83 – C$16.15 |
| 60 trading days | C$11.73 | C$7.65 – C$17.97 |
| 90 trading days | C$11.51 | C$6.83 – C$19.43 |
Methodology: Range is calculated using 30-day realized volatility via geometric Brownian motion (log-normal model). 68% band = ±1σ, 95% band = ±2σ. This is a statistical model, not a prediction. Past volatility does not guarantee future results. Not financial advice.
Advertisement
WHAT JUST HAPPENED
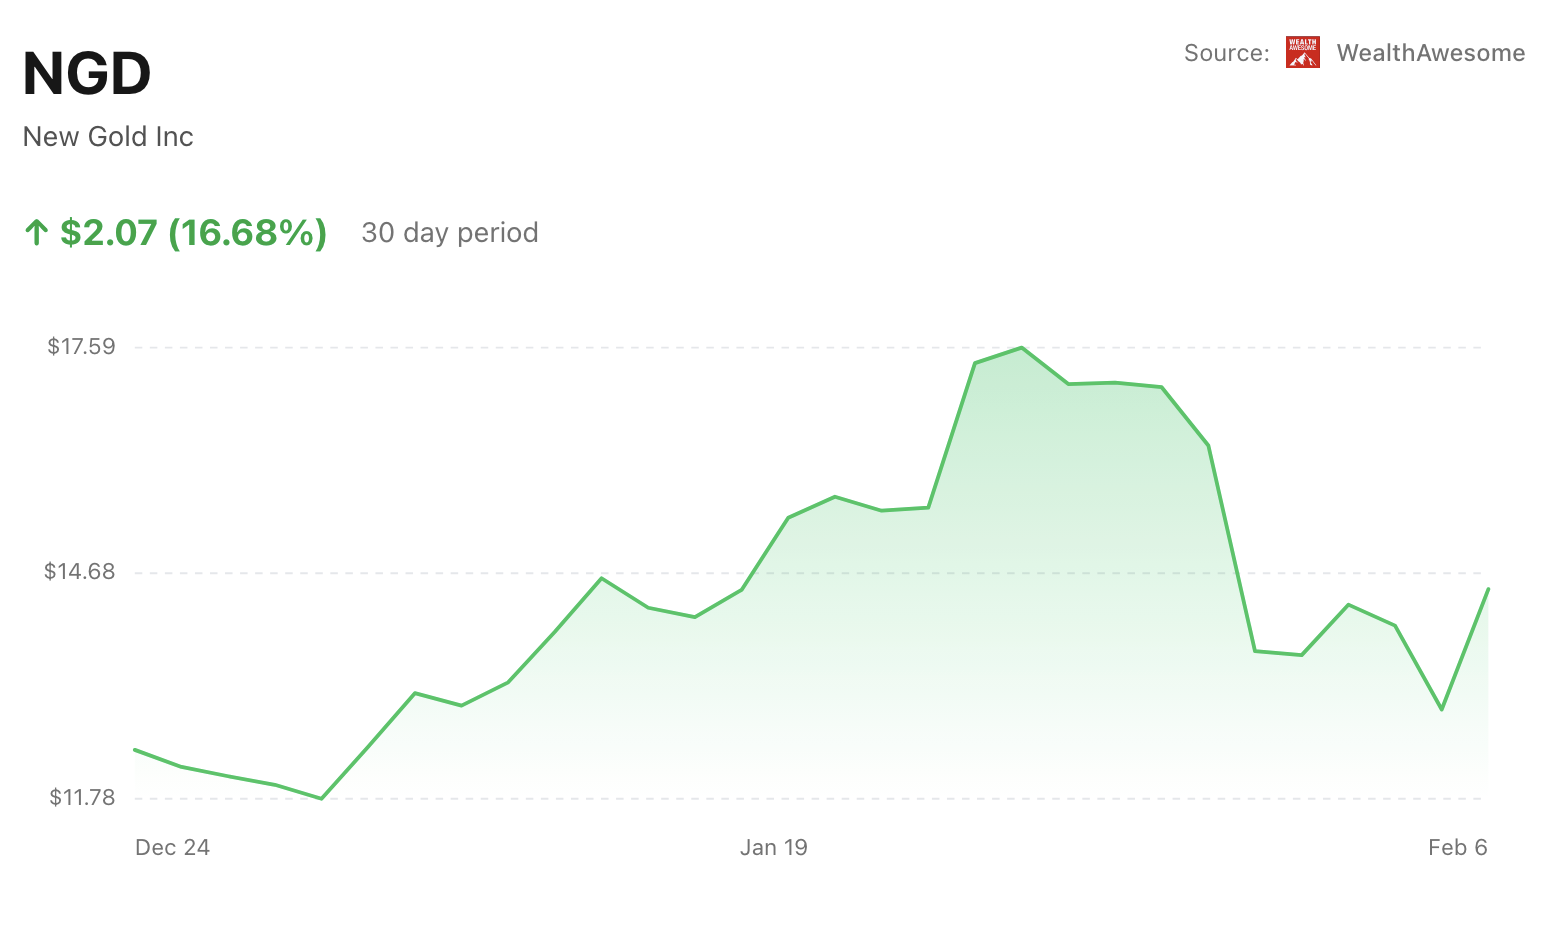
- New Gold closed at $14.48 on February 6, up 11.99% on the day
- Shares briefly touched $14.49, the high of the session
- Trading volume reached roughly 3.0 million shares, above recent averages
- The rally extended an existing advance, with the stock now up 22.9% year-to-date
The shares are trading well above both the 50-day and 200-day moving averages, underscoring the strength of the current trend.
WHY THE MARKET CARES
With no single headline driving the move, attention shifts to positioning and sector dynamics. Gold-linked equities have been back in focus as investors reassess interest-rate expectations and equity market risk, a backdrop that tends to favor miners with operating leverage.
In New Gold’s case, the rally builds on a year of improving operating performance. The company generated approximately $1.24 billion in trailing twelve-month revenue and close to $700 million in EBITDA, numbers that have shifted perception away from a turnaround narrative and toward cash generation.
The stock also fits a familiar rotation pattern. As capital moves back into materials, fund managers often gravitate toward liquid mid-cap names that can amplify sector moves. With a market capitalization around $11.5 billion and a beta of roughly 1.55, New Gold typically reacts more sharply than the broader market when sentiment improves.
Short interest remains minimal, at under 1% of the float, suggesting the move was driven by fresh buying rather than forced covering.
THE KEY NUMBER
Advertisement
+11.99%
That was New Gold’s one-day gain, placing it near the top of the TSX leaderboard. The stock is now up more than 16% over the past month and nearly 23% so far this year.
WHAT HAPPENS NEXT
After a move of this size, consolidation would be a typical next step. Holding above recent resistance would reinforce the bullish case, particularly if gold prices remain supported.
A period of sideways trading is also plausible as short-term traders take profits without meaningfully breaking the trend.
The main risk is that momentum fades in the absence of follow-through. At roughly 33 times trailing earnings, the stock leaves little room for disappointment if broader market sentiment or gold prices soften.
The next earnings report, expected later this month, is likely to be the next real test.
BOTTOM LINE
New Gold’s surge looks driven by momentum, sector rotation, and improving confidence in its operating profile rather than a single news catalyst. In a market that has been quick to reprice materials exposure, that combination was enough to push the stock sharply higher.
Best next step
Keep exploring this topic
If you want to go deeper, these are the most useful follow-up pages and tools for this topic.
Gold ETFs
Best gold ETFs in Canada
If this story is about gold, compare CGL, VALT, KILO, and miner ETFs.
Broker comparison
Best trading platforms in Canada
Compare $0-commission brokers before you act on a ticker story.
Safe cash
Best GIC rates in Canada
If the story makes you want to de-risk, compare guaranteed rates next.
HISA roundup
Best high-interest savings accounts
Keep dry powder in a no-fee savings account instead of chequing.
Advertisement

Qayyum Rajan, CFA
Qayyum is the CEO of Wealth Awesome, a leading Canadian personal finance publication. As a CFA charterholder with extensive experience in fintech, data science, and quantitative finance, he brings a unique analytical perspective to investing and wealth management.
View Full Profile →✅ Reviewed by Certified Financial Professionals
This content has been reviewed by CFA® charterholders and Certified Financial Planners (CFP®) with over a decade of experience in Canadian financial markets. All information is fact-checked against official Canadian sources and regulations.
Why these credentials matter: CFA® charterholders complete 900+ hours of rigorous study in investment analysis and ethics. CFP® professionals are held to the highest standards of financial planning competency and fiduciary duty in Canada.
⚠️ Professional Disclaimer
This content is for educational purposes only and should not be considered personalized financial advice. While our team brings professional expertise, individual circumstances vary. For personalized guidance, consult with a qualified financial advisor, tax professional, or mortgage specialist.


