Trip.com screens cheaper on two of the three valuation measures in this snapshot. H World Group has the lower PEG, so the comparison is mixed.
Trip.com Group Ltd ADR (TCOM) and H World Group Limited (HTHT) are both in the Consumer Discretionary sector and Consumer Services industry group. Their businesses differ, but comparing their valuations can still offer useful context. As of November 9, 2026, TCOM’s adjusted close was US$44.04 and HTHT’s was US$50.21. TCOM had the lower P/E and P/B, while HTHT had the lower PEG. TCOM therefore looks cheaper on more of the supplied measures, but that alone doesn’t show which stock offers better value overall.
Investor takeaway: TCOM has the lower P/E and P/B, while HTHT has the lower PEG. These figures compare the stocks on the measures provided. They don’t prove either stock is undervalued, predict future returns, or account for differences in growth, business risks, or the assumptions behind each multiple. Both stocks have a Strong Buy consensus label in our table, but that label and the analyst targets are not guarantees.
Stocks in this list
Live snapshots — open any name for the full quote and Wealth Awesome price forecast.
Trip.com Group Ltd ADR
TCOM.US
Consumer Discretionary
$44.04
$27.94B
1D
-0.74%
1W
+7.45%
H World Group Limited
HTHT.US
Consumer Discretionary
$50.21
$16.10B
1D
-1.63%
1W
+3.65%
TCOM is lower on two of three supplied multiples
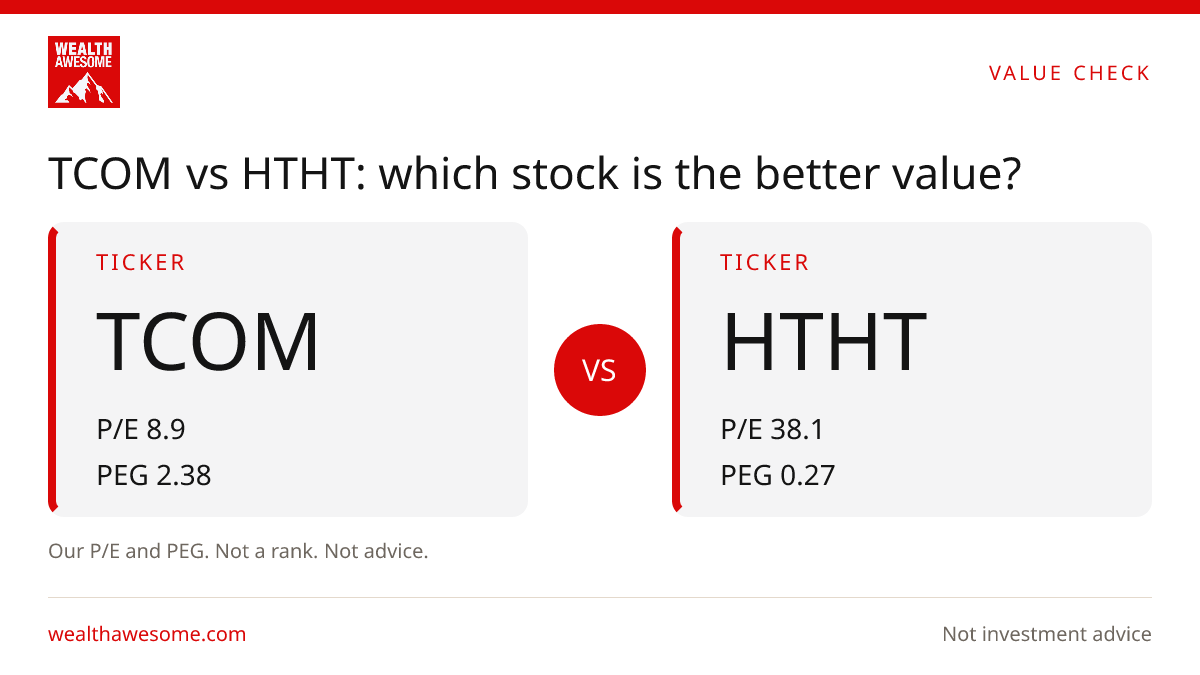
TCOM’s P/E is 8.9, compared with 38.1 for HTHT. Its P/B is 1.17, compared with HTHT’s 7.51. HTHT has the lower PEG: 0.27 versus 2.38 for TCOM. The measures point in different directions, though TCOM has the lower figure on two of the three.
Bull case
TCOM’s P/E of 8.9 and P/B of 1.17 are both below HTHT’s. The snapshot also shows TCOM’s TTM ROE at 15.7%. These figures are worth looking into, but they aren’t a reason to buy the stock on their own.
Bear case
TCOM’s PEG of 2.38 is higher than HTHT’s 0.27, and the snapshot shows no dividend yield for TCOM. A lower P/E or P/B doesn’t explain why the market values the stocks differently or mean that the gap will close.
The valuation table is split
TCOM’s P/E is 8.9, compared with 38.1 for HTHT. Its P/B is 1.17, compared with HTHT’s 7.51. On those two measures, Trip.com looks cheaper. But PEG points the other way: HTHT’s is 0.27, below TCOM’s 2.38. The snapshot doesn’t give a clear winner across all three measures. Each multiple reflects a different relationship, and none shows on its own whether a share price is justified.
Other figures add context, not a verdict
HTHT has a market cap of US$16.1B, compared with US$27.9B for TCOM. Its TTM ROE is 38.1%, versus 15.7% for TCOM. HTHT also has a dividend yield of 4.25%, while TCOM’s is 0.00%. These figures add context but don’t directly show which company is more attractive. Both have a Strong Buy consensus label in our table. The supplied analyst targets are US$58.73 for TCOM and US$60.88 for HTHT, but targets are estimates, not outcomes. For company details, see Trip.com’s stock page and H World Group’s stock page.
Best next step
Keep exploring this topic
If you want to go deeper, these are the most useful follow-up pages and tools for this topic.
Broker comparison
Best trading platforms in Canada
Compare $0-commission brokers before you act on a ticker story.
Safe cash
Best GIC rates in Canada
If the story makes you want to de-risk, compare guaranteed rates next.
HISA roundup
Best high-interest savings accounts
Keep dry powder in a no-fee savings account instead of chequing.
TFSA room
Check TFSA contribution room
Shelter the next contribution before you buy.

Wealth Awesome
Timely coverage of Canadian stocks, earnings, dividends, and market movers for DIY investors. Stories are checked against exchange data and public filings.
View Full Profile →✅ Reviewed by Certified Financial Professionals
This content has been reviewed by CFA® charterholders and Certified Financial Planners (CFP®) with over a decade of experience in Canadian financial markets. All information is fact-checked against official Canadian sources and regulations.
Why these credentials matter: CFA® charterholders complete 900+ hours of rigorous study in investment analysis and ethics. CFP® professionals are held to the highest standards of financial planning competency and fiduciary duty in Canada.
⚠️ Professional Disclaimer
This content is for educational purposes only and should not be considered personalized financial advice. While our team brings professional expertise, individual circumstances vary. For personalized guidance, consult with a qualified financial advisor, tax professional, or mortgage specialist.