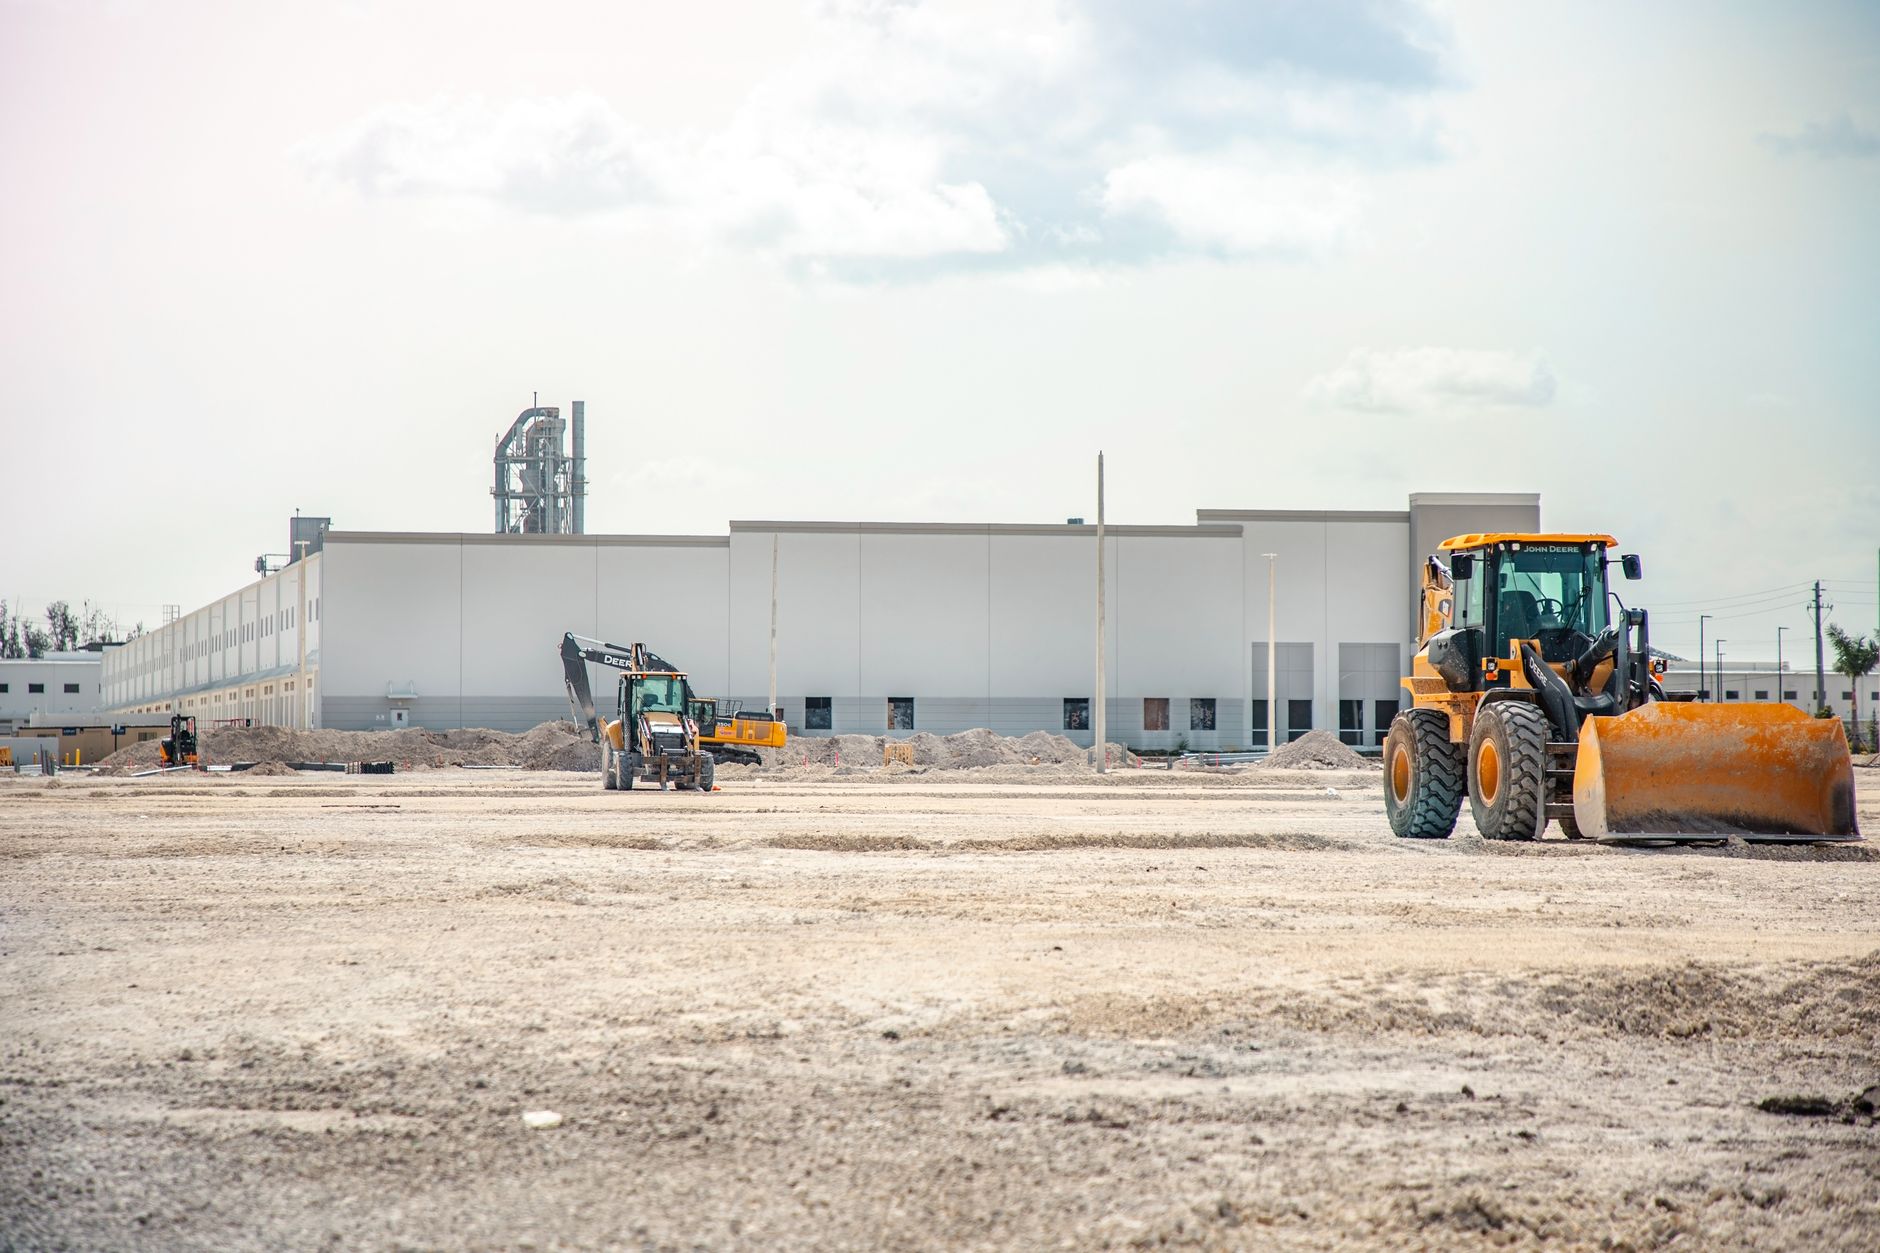
Aecon Group Inc. continues to show strong performance this week, reflecting positive developments in its project portfolio.
Aecon Group Inc. (ARE.TO) experienced a notable increase in its stock price this week, closing at C$53.93, which marks a 2.70% rise for the day and a substantial 10.92% increase over the past week. With a year-to-date performance of 71.10%, the company appears to be on an upward trajectory, driven by recent project wins and strategic developments.
Investor takeaway: Investors may want to monitor Aecon's ongoing project developments and the implications they may have on future earnings, especially given its recent contract wins and strong market performance.
Advertisement

Get up to $2,000 cash back
Open and fund a new Qtrade account with promo code SPRING26. Offer ends July 31, 2026.
Aecon Group Inc.
ARE.TO
ARE.TO
Aecon Group Inc.
 WealthAwesome
Market cap
$3.69B
P/E
98.1x
52W high
$57.47
52W low
$16.67
1W change
+10.92%
Beta
1.23
Analyst Price Targets
Based on analyst covering ARE
Wall Street analysts forecast ARE stock price to rise 4.2% over the next 12 months.
Consensus
NeutralBased on avg. target vs last close (formal rating unavailable for Canadian listings)
Avg. Target
C$56.20
+4.2% Upside
Current Price
C$53.93
Last close
Analyst ratings and price targets are updated periodically. Not financial advice.
Wealth Awesome Price Forecast
WA ModelStatistical 90-day price range based on ARE's historical volatility
30-Day Vol
49.7%
Annualized
90-Day Vol
41.5%
Annualized
Trend (90d)
+50.0%
Annualized drift
90d Mean
C$64.47
Expected price
| Horizon | Expected | 68% Range (1σ) |
|---|---|---|
| 30 trading days | C$57.24 | C$48.21 – C$67.95 |
| 60 trading days | C$60.75 | C$47.66 – C$77.43 |
| 90 trading days | C$64.47 | C$47.90 – C$86.78 |
Methodology: Range is calculated using 30-day realized volatility via geometric Brownian motion (log-normal model). 68% band = ±1σ, 95% band = ±2σ. This is a statistical model, not a prediction. Past volatility does not guarantee future results. Not financial advice.
Aecon's Stock Up 10.92% This Week Amid Contract Wins
The company has secured significant contracts that could enhance its revenue streams, contributing to its impressive year-to-date performance.
Bull case
Aecon's recent contract awards show a strong demand for its services, especially in infrastructure projects. This trend could lead to future revenue growth and increased profitability.
Bear case
Despite the positive momentum, Aecon's high P/E ratio suggests that the stock may be overvalued compared to its earnings. Any delays or issues with project execution could negatively affect its performance.
Recent Price Action
This week, Aecon Group Inc. saw its stock price rise by 10.92%, closing at C$53.93. The stock's performance was buoyed by positive developments in its project portfolio, including several significant contract wins in the infrastructure sector.
Company News and Catalysts
Aecon's recent contract awards have been pivotal in its stock performance. Notable wins include a contract for the Winnipeg North End Sewage Treatment Plant Upgrade and the Roberts Bank Terminal 2 project in British Columbia. These contracts not only enhance Aecon's project pipeline but also position the company favorably within the growing infrastructure market.
Technical Picture
Aecon's stock is currently trading well above its 50-day moving average of C$47.22 and its 200-day moving average of C$38.10, indicating strong bullish momentum. The stock's 52-week range of C$16.67 to C$57.47 shows it is currently trading at 91% of its range, suggesting it is near its high. With a beta of 1.23, the stock exhibits higher volatility compared to the market, which may appeal to risk-tolerant investors.
Volume Analysis
The latest trading volume for Aecon was 349,788 shares, which is below the 20-day average volume of 462,027 shares. This lower volume relative to the average could indicate a temporary slowdown in trading activity, despite the positive price movement.
Advertisement