CIBC Investor's Edge
Get 200 free trades when you open an eligible CIBC Investor's Edge account with promo code EDGE2026.
- ✓200 free stock & ETF trades
- ✓Unlimited commission-free trades on 180+ select ETFs
- ✓Offer ends September 30, 2026

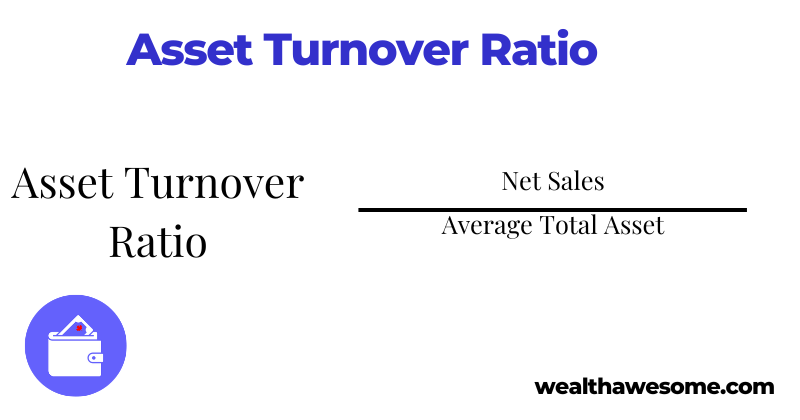
Asset Turnover Ratio
The Asset Turnover Ratio is a fundamental financial metric that evaluates how effectively a company uses its assets to generate sales revenue. This ratio is crucial for investors and analysts aiming to understand a company's operational efficiency and how well it converts asset investments into revenue.\
Advertisement
Why the Asset Turnover Ratio is Important
Understanding the Asset Turnover Ratio is essential for assessing a company's management effectiveness. It indicates how well a company is leveraging its assets to achieve sales, which is a direct measure of operational efficiency. High efficiency suggests that the company is managing its assets wisely, generating more revenue per dollar of assets, which is attractive to investors and stakeholders seeking optimal returns.
What a Typical Asset Turnover Ratio Includes
This ratio is calculated by dividing total sales or revenues by the average total assets over a given period. Total sales are the income received from normal business operations, while total assets include everything owned by the company, both current and fixed. The ratio helps gauge how much revenue a company can generate for every dollar invested in assets. A higher ratio indicates efficient use of assets, whereas a lower ratio might highlight inefficiencies or underutilization.
Examples
-
Example of a High Asset Turnover Ratio:
-
A leading retail chain has demonstrated a high Asset Turnover Ratio by optimizing its inventory management and store layout, leading to rapid stock turnover and increased sales without a proportional increase in asset base.
-
This efficiency reflects positively on the company's operational strategies, enhancing profitability and investor confidence.
-
-
Example of a Low Asset Turnover Ratio:
-
A heavy machinery manufacturer has seen a decline in its Asset Turnover Ratio after a recent substantial investment in advanced but costly equipment. Despite the technological advancement, the sales growth has not kept pace with the asset growth, resulting in a lower ratio.
-
This scenario raises concerns about asset utilization and may prompt management to reevaluate their investment and operational strategies to boost revenue generation
-
Further Insights
-
The Asset Turnover Ratio can vary significantly across different industries. For example, service-oriented businesses often exhibit higher ratios than manufacturing sectors due to lower asset base requirements. Understanding these industry-specific norms can provide more context when evaluating a company's performance.
-
One limitation of the ratio is its sensitivity to market conditions and sales cycles, which can distort the efficiency picture if not considered alongside other financial indicators.
Frequently Asked Questions about the Asset Turnover Ratio
What is the Asset Turnover Ratio formula?
The Asset Turnover Ratio is calculated using the formula: Asset Turnover Ratio=Net Sales or RevenueAverage Total Assets\text{Asset Turnover Ratio} = \frac{\text{Net Sales or Revenue}}{\text{Average Total Assets}}Asset Turnover Ratio=Average Total AssetsNet Sales or Revenue This formula helps determine how efficiently a company is using its assets to generate sales.
What is a good Asset Turnover Ratio?
Advertisement
A good Asset Turnover Ratio varies by industry due to differences in asset intensity and operational models. Generally, a higher ratio indicates more efficient use of assets. For example, ratios above 2 are common in retail due to low asset bases and high sales volumes, while capital-intensive industries like manufacturing may have lower norms.
What does a Total Asset Turnover Ratio of 0.75 mean?
A Total Asset Turnover Ratio of 0.75 means that for every dollar invested in assets, the company generates 75 cents in sales. This could suggest that the company is not using its assets efficiently, especially if the ratio is lower than the industry average or competitors.
Is 0.8 a good Asset Turnover Ratio?
Whether 0.8 is a good Asset Turnover Ratio depends on the context of the industry and the company's historical performance. In industries that typically have high asset turnover ratios, such as retail or fast-moving consumer goods, a ratio of 0.8 might be considered low and indicative of underperformance. However, in more asset-heavy industries like utilities or manufacturing, a ratio closer to 0.8 could be within the normal range.
Thank you for providing the links. Here's a draft of the section you can add to the bottom of each ratio-related article to guide readers to explore more on financial ratios:
Explore More Financial Ratios
Understanding different financial ratios can significantly enhance your insights into business performance and investment decisions. Explore our detailed articles on various financial ratios to deepen your knowledge and improve your analytical skills:
Discover how each ratio can provide unique perspectives on financial health and strategic planning to enhance your portfolio or business strategy!
Best next step
Keep exploring this topic
If you want to go deeper, these are the most useful follow-up pages and tools for this topic.
Tax planning
Estimate your take-home pay first
Use the tax calculator before choosing software, moving cash, or making a savings plan.
Banking next step
Compare high-interest savings rates
Move from banking basics into current cash rates and safer places to park your money.
Savings tool
See how compound growth adds up
Turn a practical money question into a long-term plan with a quick growth projection.
Advertisement
7 stocks to buy and hold forever
Proven winners for income investors — blue-chip dividend stocks to hold for decades.
Get the FREE Report
Qayyum Rajan, CFA
Qayyum is the CEO of Wealth Awesome, a leading Canadian personal finance publication. As a CFA charterholder with extensive experience in fintech, data science, and quantitative finance, he brings a unique analytical perspective to investing and wealth management.
View Full Profile →✅ Reviewed by Certified Financial Professionals
This content has been reviewed by CFA® charterholders and Certified Financial Planners (CFP®) with over a decade of experience in Canadian financial markets. All information is fact-checked against official Canadian sources and regulations.
Why these credentials matter: CFA® charterholders complete 900+ hours of rigorous study in investment analysis and ethics. CFP® professionals are held to the highest standards of financial planning competency and fiduciary duty in Canada.
⚠️ Professional Disclaimer
This content is for educational purposes only and should not be considered personalized financial advice. While our team brings professional expertise, individual circumstances vary. For personalized guidance, consult with a qualified financial advisor, tax professional, or mortgage specialist.