CIBC Investor's Edge
Get 200 free trades when you open an eligible CIBC Investor's Edge account with promo code EDGE2026.
- ✓200 free stock & ETF trades
- ✓Unlimited commission-free trades on 180+ select ETFs
- ✓Offer ends September 30, 2026

Information Ratio
Why the Ratio is Important
The Information Ratio (IR) is a key performance metric used in finance to assess the returns of a portfolio or fund relative to its benchmark, adjusted for risk. This ratio helps investors understand the consistency and effectiveness of a portfolio manager in generating excess returns over a benchmark, taking into account the volatility of those returns.
What a Typical Information Ratio Includes
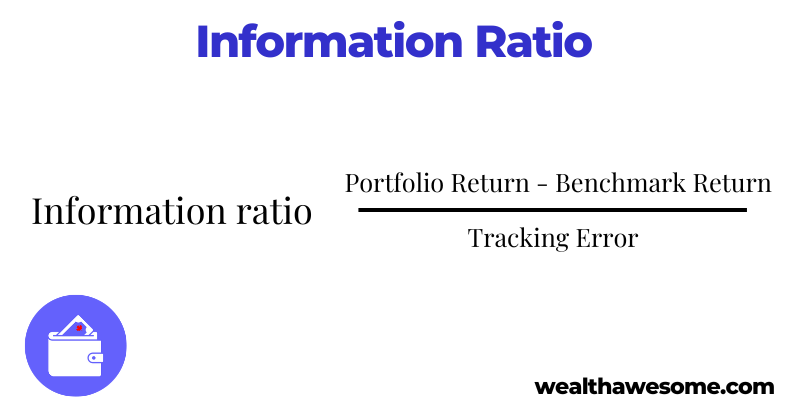
The Information Ratio is calculated using the formula: Information Ratio=Portfolio Returns - Benchmark ReturnsTracking Error\text{Information Ratio} = \frac{\text{Portfolio Returns - Benchmark Returns}}{\text{Tracking Error}} Tracking Error represents the standard deviation of the portfolio's excess returns relative to its benchmark. A higher IR suggests that the manager has consistently outperformed the benchmark with less risk.
Examples
-
Example of a High Information Ratio:
- Consider an equity mutual fund that has consistently beaten the S&P 500 index with minimal deviations in returns. A high Information Ratio in this case indicates superior performance and risk management by the fund manager, making it an attractive option for investors.
-
Example of a Low Information Ratio:
- Imagine a bond fund that aims to exceed the performance of a bond index but shows significant variability in its returns. A low Information Ratio here reflects the manager's inability to generate consistent excess returns, which might concern risk-averse investors.
https://www.youtube.com/watch?v=TV0BInQ\_2DQ
Further Insights
-
Discuss the significance of both high and low Information Ratios in making investment decisions, particularly in terms of risk vs. reward.
-
Explain how investors can use the Information Ratio alongside other metrics like the Sharpe Ratio to get a more comprehensive view of a fund manager's performance and risk management capabilities.
Frequently Asked Questions about the Information Ratio
What is the information ratio?
The Information Ratio (IR) is a financial metric used to measure the performance of an investment manager relative to a benchmark, taking into account the risk taken to achieve those returns. It is calculated by dividing the excess return of the portfolio over the benchmark by the tracking error, which is the standard deviation of those excess returns: Information Ratio=Portfolio Returns - Benchmark ReturnsTracking Error\text{Information Ratio} = \frac{\text{Portfolio Returns - Benchmark Returns}}{\text{Tracking Error}} This ratio helps investors evaluate how well a manager generates additional returns compared to the risks involved with deviating from the benchmark.
What is a good information ratio range?
A good Information Ratio generally depends on the investment strategy and the market conditions, but typically, an IR above 0.5 is considered acceptable, an IR above 0.75 is good, and an IR above 1.0 is excellent. These values indicate that the manager is not only outperforming the benchmark but is also doing so with a favorable level of risk.
What does an information ratio of 0.5 mean?
An Information Ratio of 0.5 means that the portfolio manager has achieved excess returns that are half a standard deviation greater than the benchmark. Essentially, for every unit of risk taken beyond the benchmark, the manager has added half a unit of extra return. This level of IR suggests moderate performance where the additional risks taken are somewhat compensated by higher returns, but there is room for improvement.
What is the difference between information ratio and Treynor ratio?
The Information Ratio and Treynor Ratio both measure investment performance relative to risk, but they focus on different types of risk:
-
Information Ratio: Focuses on the tracking error or the volatility of excess returns relative to a benchmark. It measures the manager’s ability to generate excess returns per unit of additional risk taken relative to a benchmark.
-
Treynor Ratio: Measures the excess return per unit of market risk taken, using beta instead of standard deviation. It calculates how well a portfolio has performed above the risk-free rate relative to the market as a whole:
While the Information Ratio is concerned with how well a manager performs relative to a specific benchmark, the Treynor Ratio is concerned with how much reward an investor is receiving for the systemic risk taken, ignoring specific idiosyncratic risks.
Explore More Financial Ratios
Understanding different financial ratios can significantly enhance your insights into business performance and investment decisions. Explore our detailed articles on various financial ratios to deepen your knowledge and improve your analytical skills:
Discover how each ratio can provide unique perspectives on financial health and strategic planning to enhance your portfolio or business strategy!
Best next step
Keep exploring this topic
If you want to go deeper, these are the most useful follow-up pages and tools for this topic.
Tax planning
Estimate your take-home pay first
Use the tax calculator before choosing software, moving cash, or making a savings plan.
Banking next step
Compare high-interest savings rates
Move from banking basics into current cash rates and safer places to park your money.
Savings tool
See how compound growth adds up
Turn a practical money question into a long-term plan with a quick growth projection.
Advertisement
7 stocks to buy and hold forever
Proven winners for income investors — blue-chip dividend stocks to hold for decades.
Get the FREE Report
Qayyum Rajan, CFA
Qayyum is the CEO of Wealth Awesome, a leading Canadian personal finance publication. As a CFA charterholder with extensive experience in fintech, data science, and quantitative finance, he brings a unique analytical perspective to investing and wealth management.
View Full Profile →✅ Reviewed by Certified Financial Professionals
This content has been reviewed by CFA® charterholders and Certified Financial Planners (CFP®) with over a decade of experience in Canadian financial markets. All information is fact-checked against official Canadian sources and regulations.
Why these credentials matter: CFA® charterholders complete 900+ hours of rigorous study in investment analysis and ethics. CFP® professionals are held to the highest standards of financial planning competency and fiduciary duty in Canada.
⚠️ Professional Disclaimer
This content is for educational purposes only and should not be considered personalized financial advice. While our team brings professional expertise, individual circumstances vary. For personalized guidance, consult with a qualified financial advisor, tax professional, or mortgage specialist.