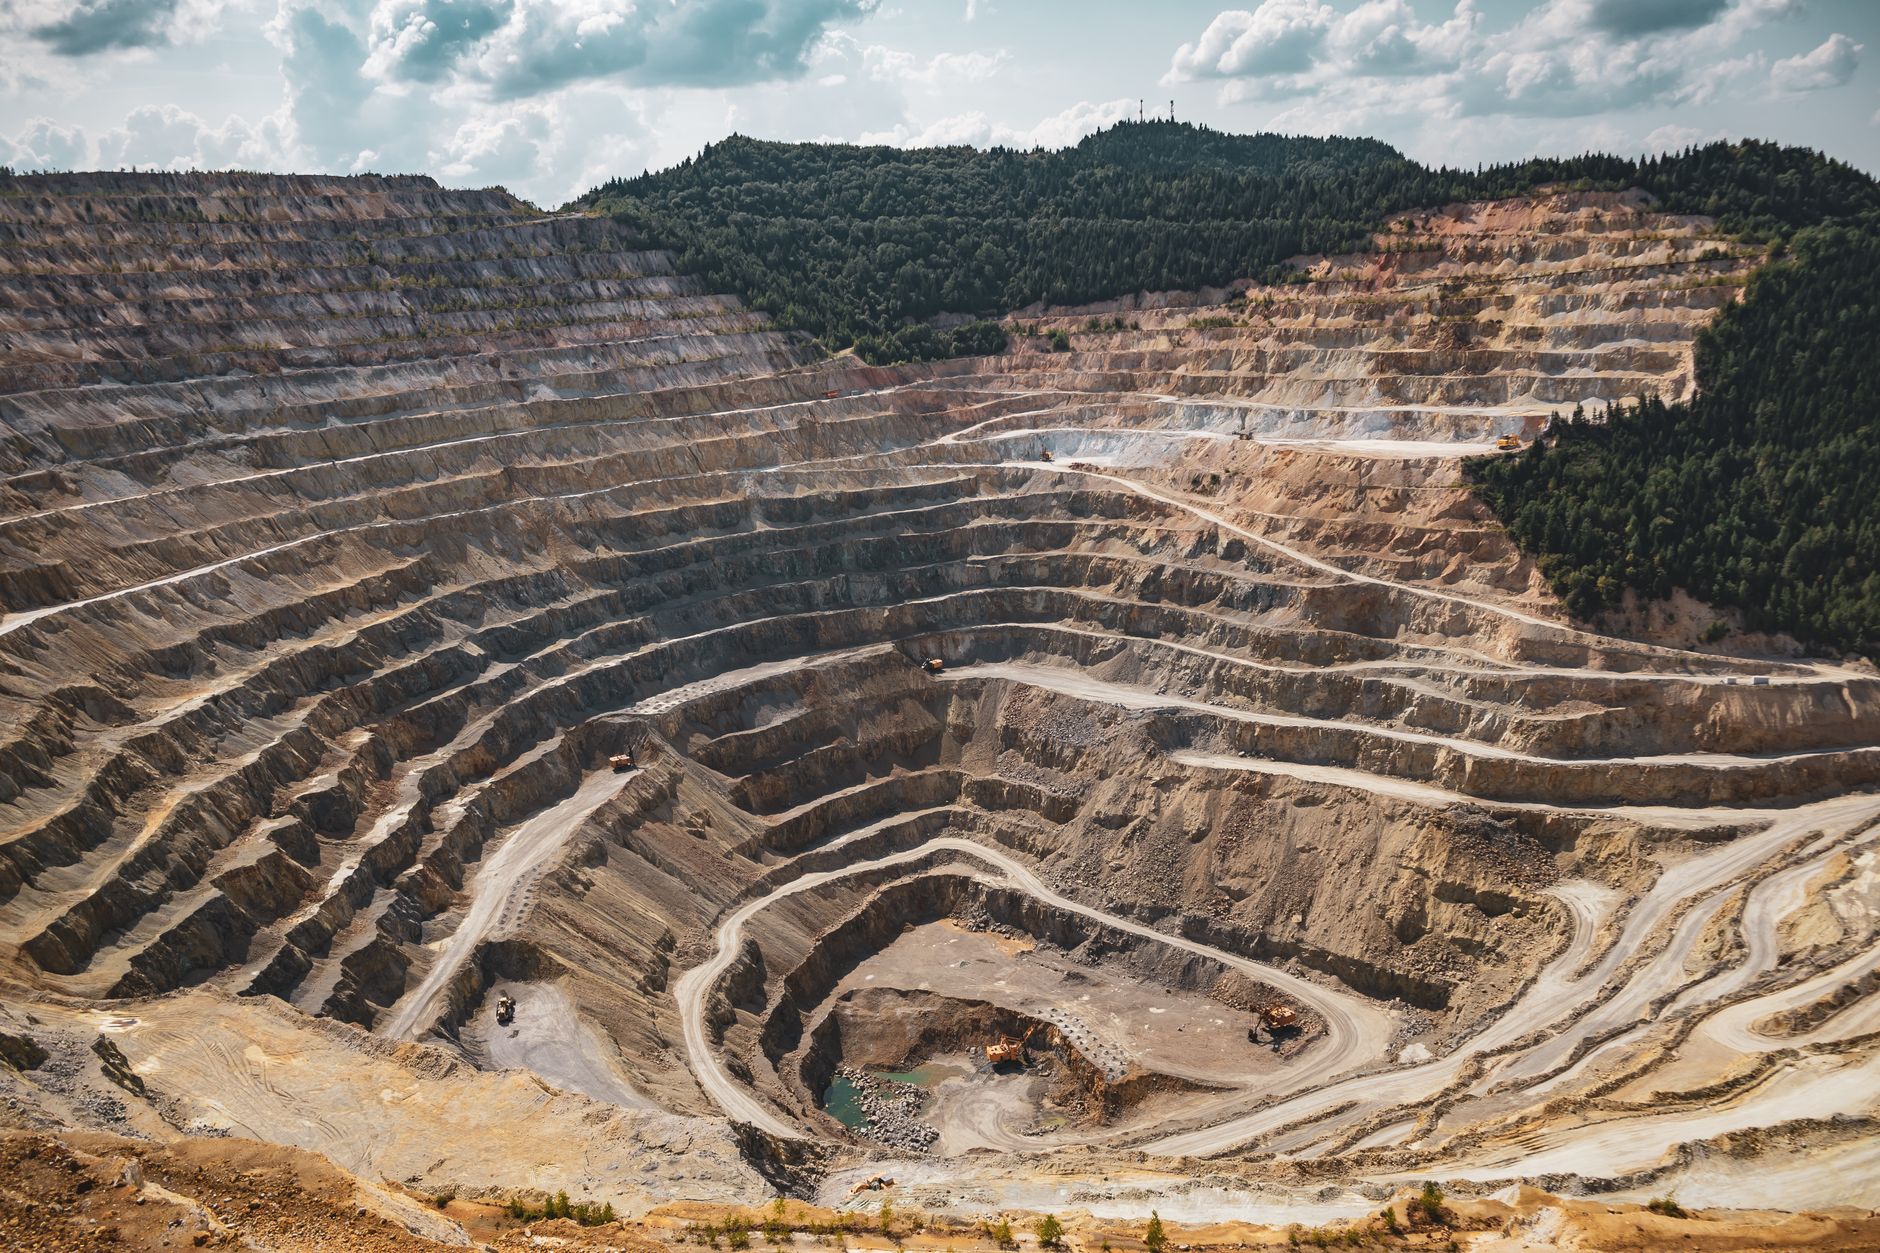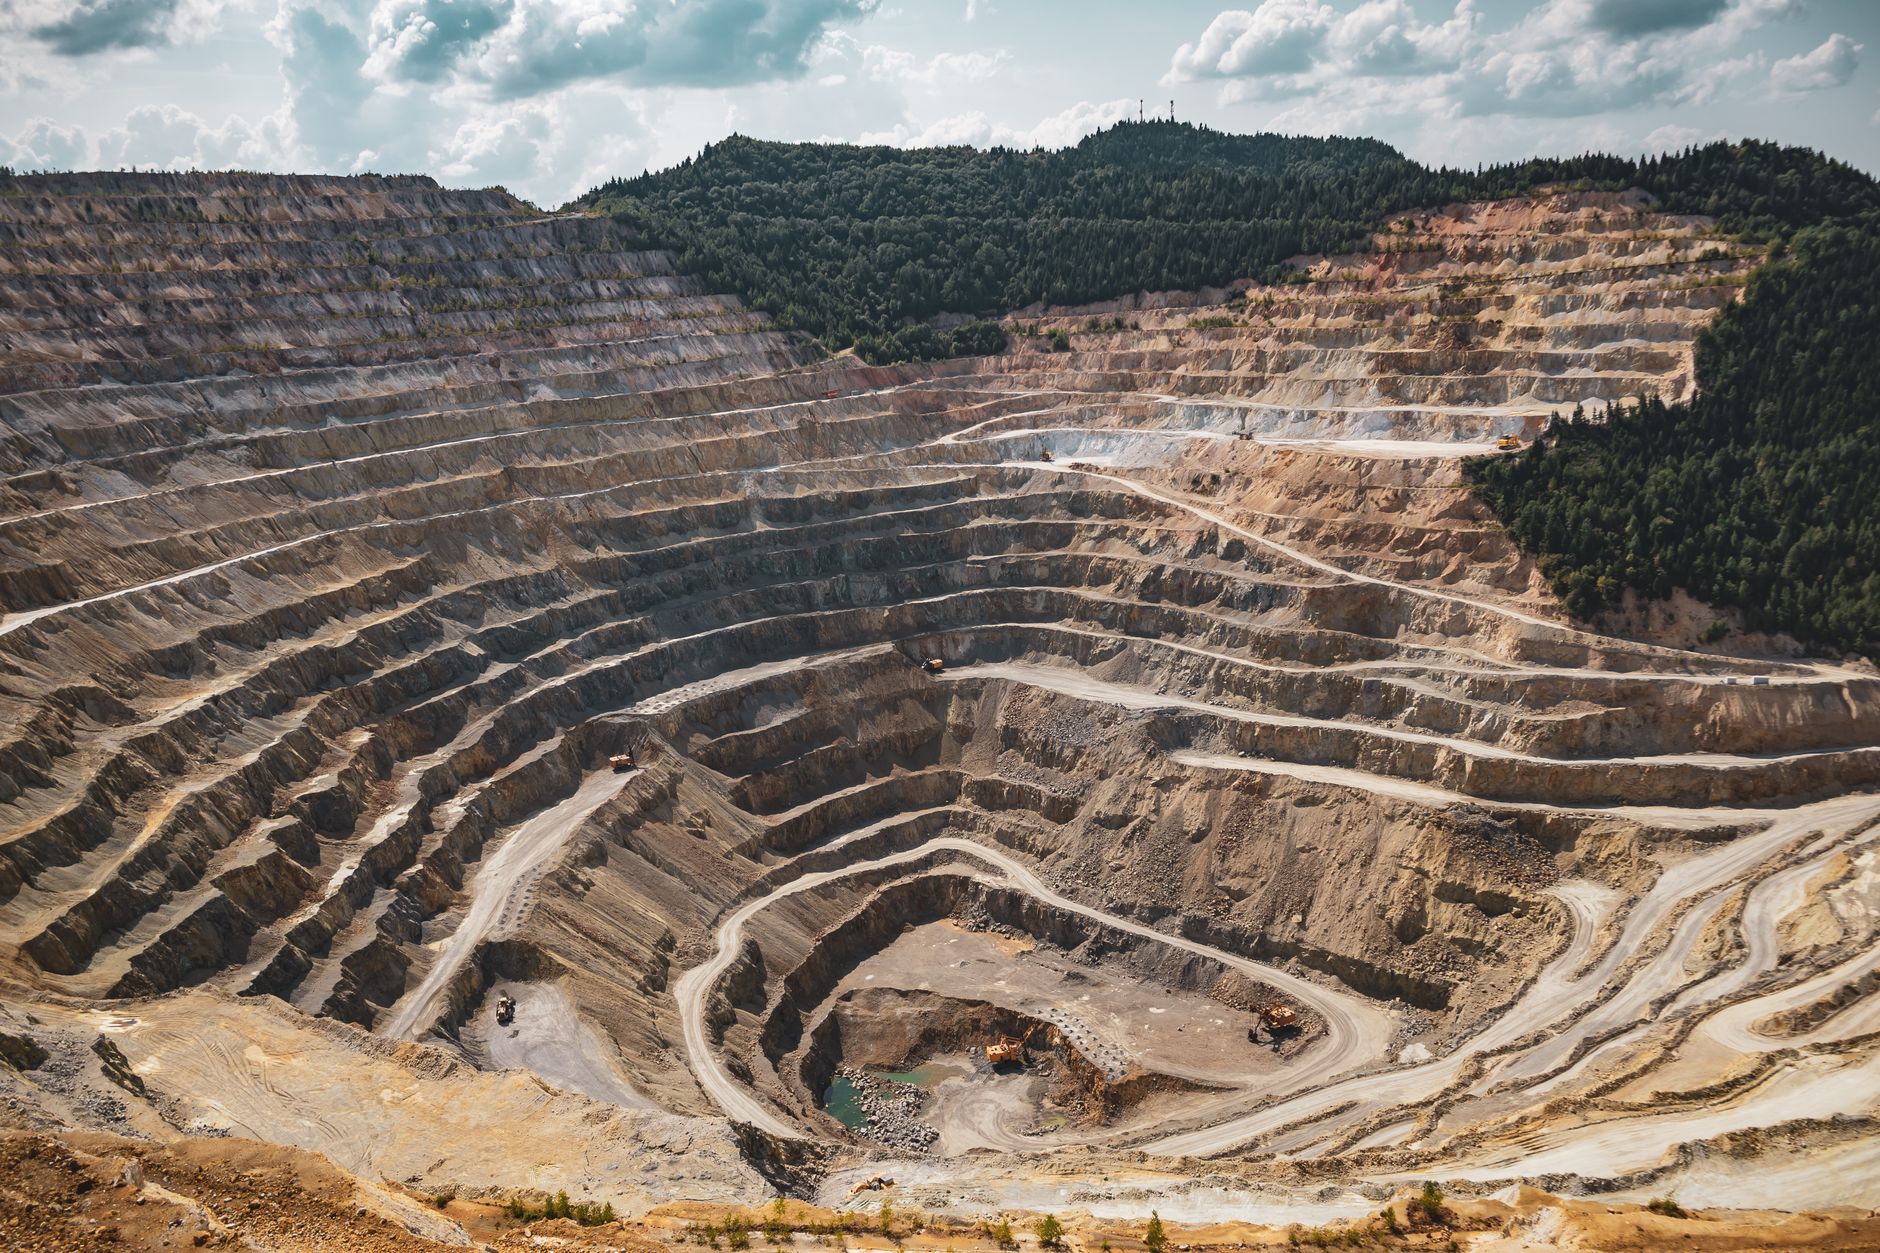
Centerra Gold’s adjusted third-quarter EPS was US$0.37, ahead of the US$0.34 estimate. Operating cash flow reached US$143.1 million.
Centerra Gold Inc. (TSX: CG) reported its third-quarter 2026 results after markets closed on October 29. Adjusted earnings came in 8.8% above the calendar estimate, marking the company’s fourth consecutive quarter ahead of estimates. Gold production and cash generation were solid, and Mount Milligan lowered its full-year cost guidance. At the same time, Centerra continued to spend heavily on the Thompson Creek restart and Goldfield development.
Recent earnings trend
Centerra Gold Inc
CG.TO
CG.TO
Centerra Gold Inc
 WealthAwesome
Market cap
$5.46B
P/E
9.4x
Div. yield
0.72%
Div. / share
$0.20
52W high
$33.94
52W low
$15.51
1W change
-0.32%
Beta
1.60
Analyst Price Targets
Based on analyst covering CG · as of Nov 2, 2026
Wall Street analysts forecast CG stock price to rise 20.3% over the next 12 months.
Consensus
BullishBased on avg. target vs last close (formal rating unavailable for Canadian listings)
Avg. Target
C$33.97
+20.3% Upside
Previously C$33.67 on Oct 30, 2026
Current Price
C$28.23
Last close
Targets are snapshotted when they change. Unchanged figures keep their original date. Not financial advice.
Wealth Awesome Price Forecast
WA ModelStatistical 90-day price range based on CG's historical volatility
30-Day Vol
40.6%
Annualized
90-Day Vol
47.7%
Annualized
Trend (90d)
+14.0%
Annualized drift
90d Mean
C$29.68
Expected price
| Horizon | Expected | 68% Range (1σ) |
|---|---|---|
| 30 trading days | C$28.70 | C$24.95 – C$33.02 |
| 60 trading days | C$29.19 | C$23.94 – C$35.58 |
| 90 trading days | C$29.68 | C$23.29 – C$37.82 |
Methodology: Range is calculated using 30-day realized volatility via geometric Brownian motion (log-normal model). 68% band = ±1σ, 95% band = ±2σ. This is a statistical model, not a prediction. Past volatility does not guarantee future results. Not financial advice.
Analyst coverage: 5 analyst(s) cover this name; upcoming EPS consensus is available.
Beat estimates in 4 of the last 4 comparable quarter(s).
| Fiscal period | Report date | Actual EPS | Estimate | Surprise |
|---|---|---|---|---|
| 2026-12-31 | 2027-02-18 | — | 0.3800 | — |
| 2026-09-30 | 2026-10-29 | 0.3700 | 0.3400 | +8.8% |
| 2026-06-30 | 2026-07-28 | 0.3900 | 0.3800 | +2.6% |
| 2026-03-31 | 2026-04-29 | 0.4400 | 0.4300 | +2.3% |
| 2025-12-31 | 2026-02-19 | 0.4100 | 0.3700 | +10.8% |
| 2025-09-30 | 2025-10-28 | 0.3300 | 0.2500 | +32.0% |
Investor takeaway: Centerra generated US$143.1 million in operating cash flow, but free cash flow was US$17.1 million after growth spending. The company’s next challenge is to turn its operating results and exposure to metal prices into steady cash generation while moving Thompson Creek toward planned first production in mid-2027. Canadian investors should weigh the C$0.07 quarterly dividend and share buybacks against project costs, mining expenses and metal-price swings.
US$0.37 adjusted EPS
Adjusted EPS was US$0.37, or US$0.03 above the US$0.34 estimate. That’s an 8.8% surprise and Centerra’s fourth consecutive comparable quarter above estimates. Net earnings were US$0.46 per share. Adjusted earnings exclude items such as deferred tax adjustments and a recovery from revaluing a reclamation provision.
Bull case
Mount Milligan delivered a fourth consecutive quarter on plan. Strong copper by-product credits helped Centerra lower the mine’s full-year AISC guidance to US$1,100–US$1,200 per ounce, from US$1,200–US$1,300. The company generated US$143.1 million in operating cash flow and completed a record US$53 million in share buybacks during the quarter. Thompson Creek remains on track for first molybdenum production in mid-2027, and Goldfield has received its major permits.
Bear case
Free cash flow was US$17.1 million, despite positive operating cash flow, as Centerra continued to fund growth projects. Thompson Creek and Goldfield accounted for much of the quarter’s US$124.8 million in non-sustaining capital spending. The US Moly segment also had a free-cash-flow deficit, mainly due to restart costs. Labor, diesel and other expenses remain a concern, and molybdenum sales are exposed to spot prices because there’s no practical hedging market.
Analysis
For the quarter ended September 30, Centerra reported adjusted net earnings of US$71.8 million, or US$0.37 per share. That was 8.8% above the US$0.34 calendar estimate. Reported net earnings were US$88.7 million, or US$0.46 per share. The adjusted figure excludes items such as US$10.2 million in deferred income tax adjustments and a US$7.2 million recovery from revaluing a reclamation provision. Centerra has now beaten estimates in each of its last four comparable quarters. The recent-earnings trend table shows the results by quarter.
Cash from operating activities was US$143.1 million, while free cash flow was US$17.1 million. Centerra sold 74,387 ounces of gold at an average realized price of US$3,483 per ounce and 13.2 million pounds of copper at US$5.74 per pound. Consolidated gold production costs were US$1,505 per ounce, and by-product AISC was US$1,775 per ounce. The company said it remains on track to meet its full-year consolidated AISC guidance of US$1,650–US$1,750 per ounce.
Mount Milligan produced 44,070 ounces of gold and 12.8 million pounds of copper. Centerra lowered the mine’s full-year by-product AISC guidance to US$1,100–US$1,200 per ounce, citing copper by-product credits. Öksüt produced 31,359 ounces of gold and remains on track to meet its previously increased production guidance. Centerra also continued investing in growth, with US$124.8 million in non-sustaining capital spending during the quarter, mainly on Thompson Creek and Goldfield.
Analysis
Centerra bought back US$53 million of shares during the quarter, bringing year-to-date buybacks to US$125 million. Its board also declared a quarterly dividend of C$0.07 per common share, payable December 2 to shareholders of record on November 19. The dividend is eligible for Canadian income tax treatment. Future payments depend on the board’s assessment of results, cash flow, capital needs and business conditions.
The growth pipeline is central to Centerra’s investment case, but it also requires significant spending. Thompson Creek remains on track for first molybdenum production in mid-2027. Refurbishment is progressing, and commissioning work is expected to begin in 2027. Centerra estimates total capital spending on the project at US$425–US$450 million. Goldfield has received its major permits, and the company expects to complete the Kemess pre-feasibility study in mid-2027.
Investors will need to weigh shareholder returns against the cost of funding these projects. Centerra reported US$998 million in total liquidity, including US$398 million in cash and US$600 million available under its credit facility. But cost inflation at Mount Milligan and Öksüt, along with unhedged molybdenum exposure, leaves results vulnerable to operating conditions and commodity prices. Visit the Centerra Gold stock page for more company data and the analyst ratings section for target-price context.
Analysis
The supplied analyst-target data gives an average target of C$33.97, compared with the last close of C$28.23. That implies 20.3% upside to the average target. The source describes the consensus view as bullish based on the target-versus-close comparison, but the supplied data doesn’t include a formal rating for the Canadian listing. Analyst targets are estimates, not promises, and can change as assumptions are updated.
Wealth Awesome’s statistical 90-day price model gives a mean forecast of C$29.68. Its 68% range is C$23.29–C$37.82, and its 95% range is C$18.27–C$48.20. This statistical model isn’t financial advice or a recommendation to buy or sell. The wide ranges reflect the uncertainty around a mining stock exposed to metal prices, operating costs and project execution. See the Wealth Awesome price forecast section for more detail.
Best next step
Keep exploring this topic
If you want to go deeper, these are the most useful follow-up pages and tools for this topic.
Gold ETFs
Best gold ETFs in Canada
If this story is about gold, compare CGL, VALT, KILO, and miner ETFs.
Broker comparison
Best trading platforms in Canada
Compare $0-commission brokers before you act on a ticker story.
Safe cash
Best GIC rates in Canada
If the story makes you want to de-risk, compare guaranteed rates next.
HISA roundup
Best high-interest savings accounts
Keep dry powder in a no-fee savings account instead of chequing.

Wealth Awesome
Timely coverage of Canadian stocks, earnings, dividends, and market movers for DIY investors. Stories are checked against exchange data and public filings.
View Full Profile →✅ Reviewed by Certified Financial Professionals
This content has been reviewed by CFA® charterholders and Certified Financial Planners (CFP®) with over a decade of experience in Canadian financial markets. All information is fact-checked against official Canadian sources and regulations.
Why these credentials matter: CFA® charterholders complete 900+ hours of rigorous study in investment analysis and ethics. CFP® professionals are held to the highest standards of financial planning competency and fiduciary duty in Canada.
⚠️ Professional Disclaimer
This content is for educational purposes only and should not be considered personalized financial advice. While our team brings professional expertise, individual circumstances vary. For personalized guidance, consult with a qualified financial advisor, tax professional, or mortgage specialist.