OceanaGold Corporation (OGC : TSX)
Common Stock
$31.20
CAD
-0.22 (-0.70%)
Last updated: 2026-07-20
OGC
OceanaGold Corporation
Performance
1 Day
-0.70%
1 Week
-8.58%
1 Month
-14.87%
YTD
-19.48%
Key Statistics
Market Cap
$7.03B
52W High
$58.88
52W Low
$18.36
P/E Ratio
6.74
50 Day MA
$38.16
200 Day MA
$40.86
Beta
1.50
Dividend Yield
0.57%
Technical Indicators
Price vs 50-Day SMA
Price vs 200-Day SMA
Recent Price History
| Date | Open | High | Low | Close | Adj Close | Volume |
|---|---|---|---|---|---|---|
| 7/20/2026 | $31.53 | $31.74 | $31.15 | $31.20 | $31.20 | 999,462 |
| 7/17/2026 | $30.92 | $31.85 | $30.67 | $31.42 | $31.42 | 457,919 |
| 7/16/2026 | $32.42 | $32.59 | $31.05 | $31.65 | $31.65 | 1,570,353 |
| 7/15/2026 | $33.35 | $33.45 | $32.29 | $33.04 | $33.04 | 1,120,219 |
| 7/14/2026 | $35.33 | $35.50 | $33.02 | $33.34 | $33.34 | 949,895 |
| 7/13/2026 | $34.47 | $34.84 | $33.81 | $34.13 | $34.13 | 475,479 |
| 7/10/2026 | $35.06 | $35.33 | $34.57 | $35.01 | $35.01 | 417,038 |
| 7/9/2026 | $34.88 | $35.66 | $34.50 | $35.24 | $35.24 | 1,031,404 |
| 7/8/2026 | $33.89 | $34.80 | $33.40 | $34.29 | $34.29 | 347,749 |
| 7/7/2026 | $36.30 | $36.70 | $34.53 | $34.86 | $34.86 | 1,029,385 |
Analyst Price Targets
Based on analyst covering OGC
Wall Street analysts forecast OGC stock price to rise 95.0% over the next 12 months.
Consensus
BullishBased on avg. target vs last close (formal rating unavailable for Canadian listings)
Avg. Target
C$60.84
+95.0% Upside
Current Price
C$31.20
Last close
Analyst ratings and price targets are updated periodically. Not financial advice.
Wealth Awesome Price Forecast
WA ModelStatistical 90-day price range based on OGC's historical volatility
30-Day Vol
49.6%
Annualized
90-Day Vol
53.5%
Annualized
Trend (90d)
-50.0%
Annualized drift
90d Mean
C$26.10
Expected price
| Horizon | Expected | 68% Range (1σ) |
|---|---|---|
| 30 trading days | C$29.40 | C$24.78 – C$34.88 |
| 60 trading days | C$27.70 | C$21.75 – C$35.28 |
| 90 trading days | C$26.10 | C$19.41 – C$35.10 |
Methodology: Range is calculated using 30-day realized volatility via geometric Brownian motion (log-normal model). 68% band = ±1σ, 95% band = ±2σ. This is a statistical model, not a prediction. Past volatility does not guarantee future results. Not financial advice.
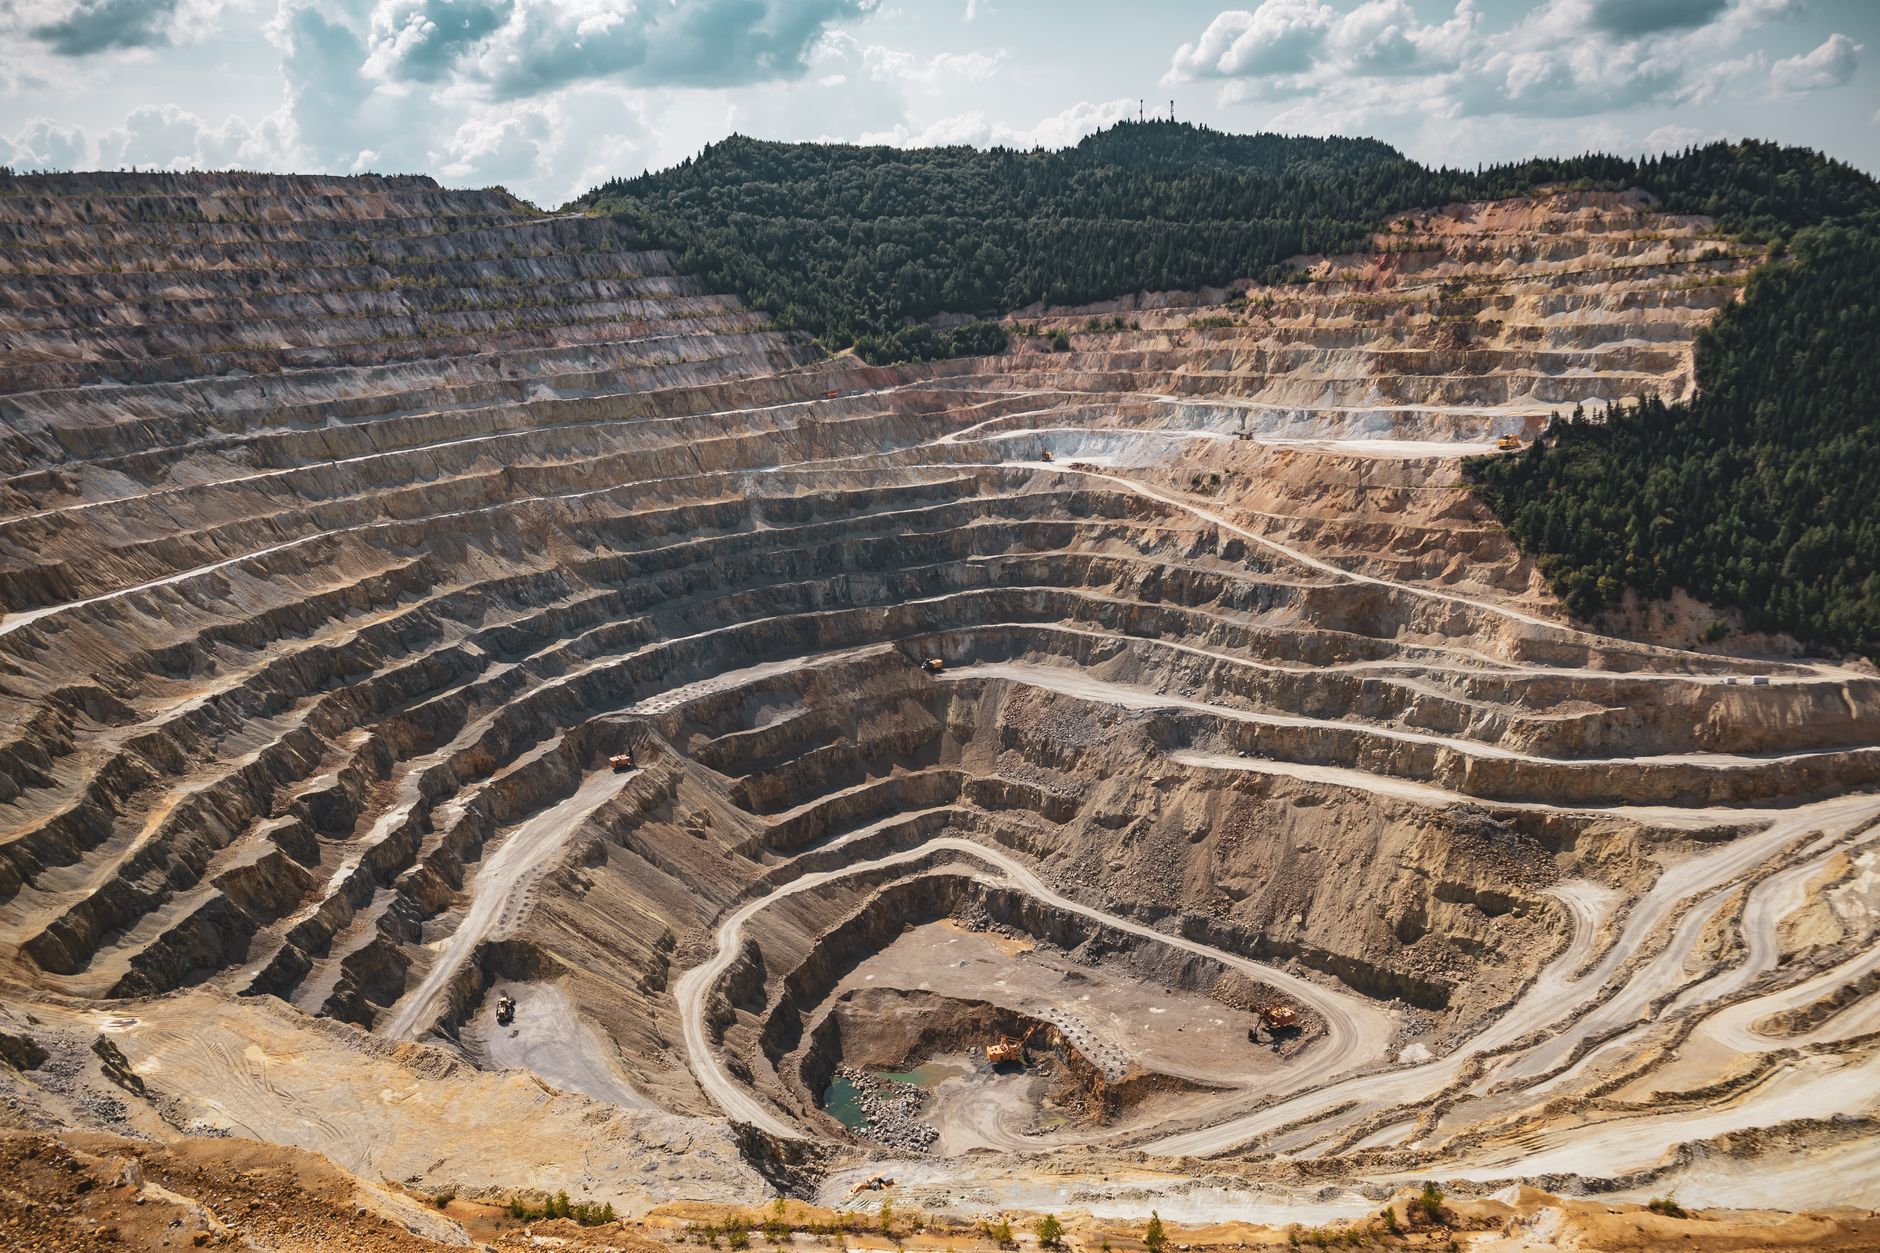
About OceanaGold Corporation
OceanaGold Corporation engages in the exploration, development, and operation of gold and gold/copper mines in the United States, the Philippines, and New Zealand. It explores for gold, copper, and silver deposits. The company was founded in 1990 and is headquartered in Vancouver, Canada.
Financials
- Revenue (TTM)
- $2.25B
- EBITDA
- $1.25B
- Profit Margin
- 33.70%
- ROE (TTM)
- 34.65%
- EPS (Diluted)
- 4.66
- Book Value
- 14.96
Classification
- Sector
- Materials
- Industry
- Metals & Mining
- Group
- Materials
🔄 Recent Splits
1-for-3
Jun 23, 2025
💰 Recent Dividends
$0.1230
Ex: Mar 4, 2026
$0.0420
Ex: Nov 19, 2025
Pay: Dec 19
$0.0420
Ex: Aug 20, 2025
Pay: Sep 19
$0.0420
Ex: May 21, 2025
Pay: Jun 20
$0.0420
Ex: Mar 5, 2025
Pay: Apr 25
$0.0390
Ex: Aug 29, 2024
Pay: Oct 11
$0.0420
Ex: Mar 6, 2024
Pay: Apr 26
$0.0420
Ex: Aug 23, 2023
Pay: Oct 6
Advertisement
7 stocks to buy and hold forever
Blue-chip dividend stocks for long-term wealth building.
Get the FREE ReportExplore More
Common Questions About OGC
Articles Featuring OGC.TO
Latest articles and analysis covering OGC.TO
What's Going On With OceanaGold Corporation Stock Thursday?
OceanaGold Corporation has faced a challenging week with its stock price declining. Recent news regarding drilling results and upcoming earnings may impact investor sentiment moving forward.

Why OceanaGold Corporation stock is tanking today
OceanaGold Corporation's stock has dropped 1.88% in the latest session, raising concerns among investors about the company's future performance and market conditions.

Why OceanaGold Corporation stock is rising today
OceanaGold Corporation's stock rose by 3.73% in the last session, driven by positive market sentiment ahead of its second-quarter earnings release.

Why OceanaGold Corporation stock is sliding today
OceanaGold Corporation's stock slid by 4.24% in the last trading session, closing at CA$35.04. This decline raises concerns among investors about the company's future performance, especially with key financial results on the horizon.
Why OceanaGold Corporation stock is sliding today
OceanaGold Corporation's stock slid 2.66% today, closing at CA$36.94. This decline raises concerns among investors despite the company's solid fundamentals and recent achievements.

Why OceanaGold Corporation stock is rising today
OceanaGold Corporation's stock has seen a positive uptick of 3.30%, reflecting strong investor sentiment and confidence in its operational capabilities.

Why OceanaGold Corporation stock is sliding today
OceanaGold Corporation's stock took a hit today, closing down 2.97%. Investors are left questioning the sustainability of its recent successes in light of this one-day performance.

Why OceanaGold Corporation stock is sliding today
OceanaGold Corporation's stock price has slid 3.44% in the last trading session, raising concerns among investors about its future performance amidst a backdrop of significant recent losses.

Why OceanaGold Corporation stock is rising today
OceanaGold Corporation's stock has rebounded with a 2.98% increase, drawing attention from investors who see potential in its undervalued status amidst a backdrop of recent price weakness.

OceanaGold Corporation Surges 4% in Last Session — What’s Behind the Rebound?
OceanaGold Corporation's 4% gain in the last session raises questions about its valuation amidst recent price declines. Investors are weighing its long-term potential against short-term volatility.

Why OceanaGold Corporation stock is rising today
OceanaGold Corporation's stock has rebounded with a 2.65% rise, attracting investor attention after a month of declines. As the company navigates its elevated cost profile and jurisdictional risks, its long-term performance remains a point of interest for those looking to capitalize on potential undervaluation.

Why OceanaGold Corporation stock is skyrocketing today
OceanaGold Corporation's stock has surged by 6% in the latest trading session, drawing attention from investors amidst recent fluctuations. This uptick comes after a period of volatility, where the stock had previously faced a decline of 4% over the past day and 25% over the last month.

Why OceanaGold Corporation stock is gaining today
OceanaGold Corporation's stock has gained 1.67% today, reflecting strong investor confidence and positive operational metrics.

OceanaGold Corporation (OGC.TO) Surges 5% After Positive Earnings Guidance
OceanaGold Corporation's shares surged 5% last session, driven by strong earnings guidance and solid fundamentals. Here's what investors should consider.