Altius Minerals Corporation (ALS : TSX)
Common Stock
$56.92
CAD
+1.30 (2.34%)
Last updated: 2026-07-20
ALS
Altius Minerals Corporation
Performance
1 Day
+2.34%
1 Week
-7.99%
1 Month
-5.54%
YTD
+37.95%
Key Statistics
Market Cap
$3.10B
52W High
$66.05
52W Low
$27.07
P/E Ratio
8.88
50 Day MA
$58.06
200 Day MA
$46.86
Beta
0.51
Dividend Yield
-
Technical Indicators
Price vs 50-Day SMA
Price vs 200-Day SMA
Recent Price History
| Date | Open | High | Low | Close | Adj Close | Volume |
|---|---|---|---|---|---|---|
| 7/20/2026 | $55.81 | $57.28 | $55.68 | $56.92 | $56.92 | 301,951 |
| 7/17/2026 | $56.43 | $56.68 | $54.96 | $55.62 | $55.62 | 382,819 |
| 7/16/2026 | $55.68 | $57.89 | $55.04 | $57.46 | $57.46 | 416,710 |
| 7/15/2026 | $59.35 | $59.35 | $55.56 | $56.05 | $56.05 | 1,415,367 |
| 7/14/2026 | $62.48 | $66.05 | $62.48 | $66.04 | $66.04 | 291,376 |
| 7/13/2026 | $62.40 | $62.65 | $60.71 | $61.86 | $61.86 | 253,479 |
| 7/10/2026 | $61.21 | $63.86 | $61.19 | $62.74 | $62.74 | 213,918 |
| 7/9/2026 | $61.07 | $63.07 | $61.03 | $62.23 | $62.23 | 158,635 |
| 7/8/2026 | $60.41 | $61.76 | $59.23 | $60.74 | $60.74 | 243,405 |
| 7/7/2026 | $62.88 | $64.27 | $59.61 | $61.31 | $61.31 | 251,891 |
Analyst Price Targets
Based on analyst covering ALS
Wall Street analysts forecast ALS stock price to rise 16.4% over the next 12 months.
Consensus
BullishBased on avg. target vs last close (formal rating unavailable for Canadian listings)
Avg. Target
C$66.25
+16.4% Upside
Current Price
C$56.92
Last close
Analyst ratings and price targets are updated periodically. Not financial advice.
Wealth Awesome Price Forecast
WA ModelStatistical 90-day price range based on ALS's historical volatility
30-Day Vol
64.3%
Annualized
90-Day Vol
48.2%
Annualized
Trend (90d)
+41.2%
Annualized drift
90d Mean
C$65.95
Expected price
| Horizon | Expected | 68% Range (1σ) |
|---|---|---|
| 30 trading days | C$59.78 | C$47.89 – C$74.64 |
| 60 trading days | C$62.79 | C$45.88 – C$85.93 |
| 90 trading days | C$65.95 | C$44.90 – C$96.85 |
Methodology: Range is calculated using 30-day realized volatility via geometric Brownian motion (log-normal model). 68% band = ±1σ, 95% band = ±2σ. This is a statistical model, not a prediction. Past volatility does not guarantee future results. Not financial advice.
About Altius Minerals Corporation
Altius Minerals Corporation engages in the mineral and renewable royalties and project generation businesses in Canada, Brazil, and the United States. The company operates in three segments: Mineral Royalties, Renewable Royalties and Project Generation. It owns royalty and streaming interests in 11 operating mines covering copper, nickel, cobalt, lithium, potash, and iron ore. The company is also involved in the acquisition and management of renewable energy investments and royalties, as well as early-stage royalties and minority equity or project interests. Altius Minerals Corporation was incorporated in 1997 and is headquartered in St. John's, Canada.
Financials
- Revenue (TTM)
- $50.34M
- EBITDA
- $33.78M
- Profit Margin
- 62.81%
- ROE (TTM)
- 40.81%
- EPS (Diluted)
- 6.26
- Book Value
- 23.86
Classification
- Sector
- Materials
- Industry
- Metals & Mining
- Group
- Materials
💰 Recent Dividends
$0.1000
Ex: May 29, 2026
$0.1000
Ex: Nov 28, 2025
Pay: Dec 15
$0.1000
Ex: Aug 29, 2025
Pay: Sep 15
$0.0900
Ex: May 30, 2025
Pay: Jun 16
$0.0900
Ex: Mar 19, 2025
Pay: Apr 2
$0.0900
Ex: Nov 29, 2024
Pay: Dec 16
$0.0900
Ex: Aug 30, 2024
Pay: Sep 16
$0.0900
Ex: May 31, 2024
Pay: Jun 14
$0.0800
Ex: Mar 15, 2024
Pay: Apr 1
$0.0800
Ex: Nov 29, 2023
Pay: Dec 15
Advertisement
7 stocks to buy and hold forever
Blue-chip dividend stocks for long-term wealth building.
Get the FREE ReportExplore More
Common Questions About ALS
Articles Featuring ALS.TO
Latest articles and analysis covering ALS.TO
Why Altius Minerals Corporation stock is gaining today
Altius Minerals Corporation's stock has gained 1.87% today, closing at CA$56.66, buoyed by positive investor sentiment and strategic developments in its project portfolio.

What's Going On With Altius Minerals Corporation Stock Monday?
Altius Minerals Corporation's stock has faced a downturn this week, with a 3.20% drop today and an 11.35% decline over the past week. The company's recent strategic move to increase its stake in Great Bay Renewables may influence future growth but comes amid a challenging market environment.
Why Altius Minerals Corporation stock is rising today
Altius Minerals Corporation's recent partnership and acquisition strategy has led to a notable rise in its stock price, reflecting investor optimism about the company's future in the renewable energy space.

Why Altius Minerals Corporation stock is plummeting today
Altius Minerals Corporation's stock plummeted by 15.13% in the last trading session, closing at CA$56.05. This decline raises questions about the company's recent strategic decisions, particularly its acquisition of a larger stake in Great Bay Renewables.

Altius Minerals Corporation (ALS.TO) Faces 5% Loss Over the Week Amid Ownership Expansion
Altius Minerals Corporation's stock fell 5% this week, even as it announced a significant increase in its stake in Great Bay Renewables. Investors are weighing the implications of this strategic move.

Why Altius Minerals Corporation stock is plummeting today
Altius Minerals Corporation's stock has plummeted by nearly 14% in today's trading session, raising questions about the effectiveness of its recent strategic moves in the renewable energy sector.
Why Altius Minerals Corporation stock is rising today
Altius Minerals Corporation's stock rose by 4.45% following its announcement to increase its stake in Great Bay Renewables, signaling a strategic push into the renewable energy market.

What's Going On With Altius Minerals Corporation Stock Monday?
Altius Minerals Corporation's stock closed at C$61.86 this week, reflecting a slight increase amidst broader market fluctuations. The company's recent news regarding its ownership stake in Great Bay Renewables suggests a strategic pivot towards renewable energy, which may bolster investor confidence going forward.

Why Altius Minerals Corporation stock is rising today
Altius Minerals Corporation's stock price has risen by 2.63% in the latest trading session, reflecting investor confidence and positive market dynamics. With a strong market cap and increasing revenues, the company appears to be on a promising trajectory.

Why Altius Minerals Corporation stock is rising today
Altius Minerals Corporation's stock has risen by 2.79% in the latest trading session, reflecting strong investor confidence driven by positive financial updates and portfolio growth.
Why Altius Minerals Corporation stock is gaining today
Altius Minerals Corporation's stock gained 0.74% in the last session, closing at CA$60.20, driven by strong financial results and its recent inclusion in the S&P/TSX Composite Index.
Why Altius Minerals Corporation stock is tanking today
Altius Minerals Corporation (ALS.TO) faced a challenging trading day, with its stock price falling 1.18% to CA$60.14. This decline could reflect broader market trends or specific concerns regarding the company's future performance.
Why Altius Minerals Corporation stock is rising today
Altius Minerals Corporation's stock has risen by 2.39% today, reflecting positive sentiment among investors as the company continues to report strong financial results.

Why Altius Minerals Corporation stock is rising today
Altius Minerals Corporation (ALS.TO) is on the rise, gaining 2.58% in the last trading session. The stock's upward trajectory is largely attributed to its upcoming inclusion in the S&P/TSX Composite Index, which is set to enhance its visibility and attract a broader investor base.
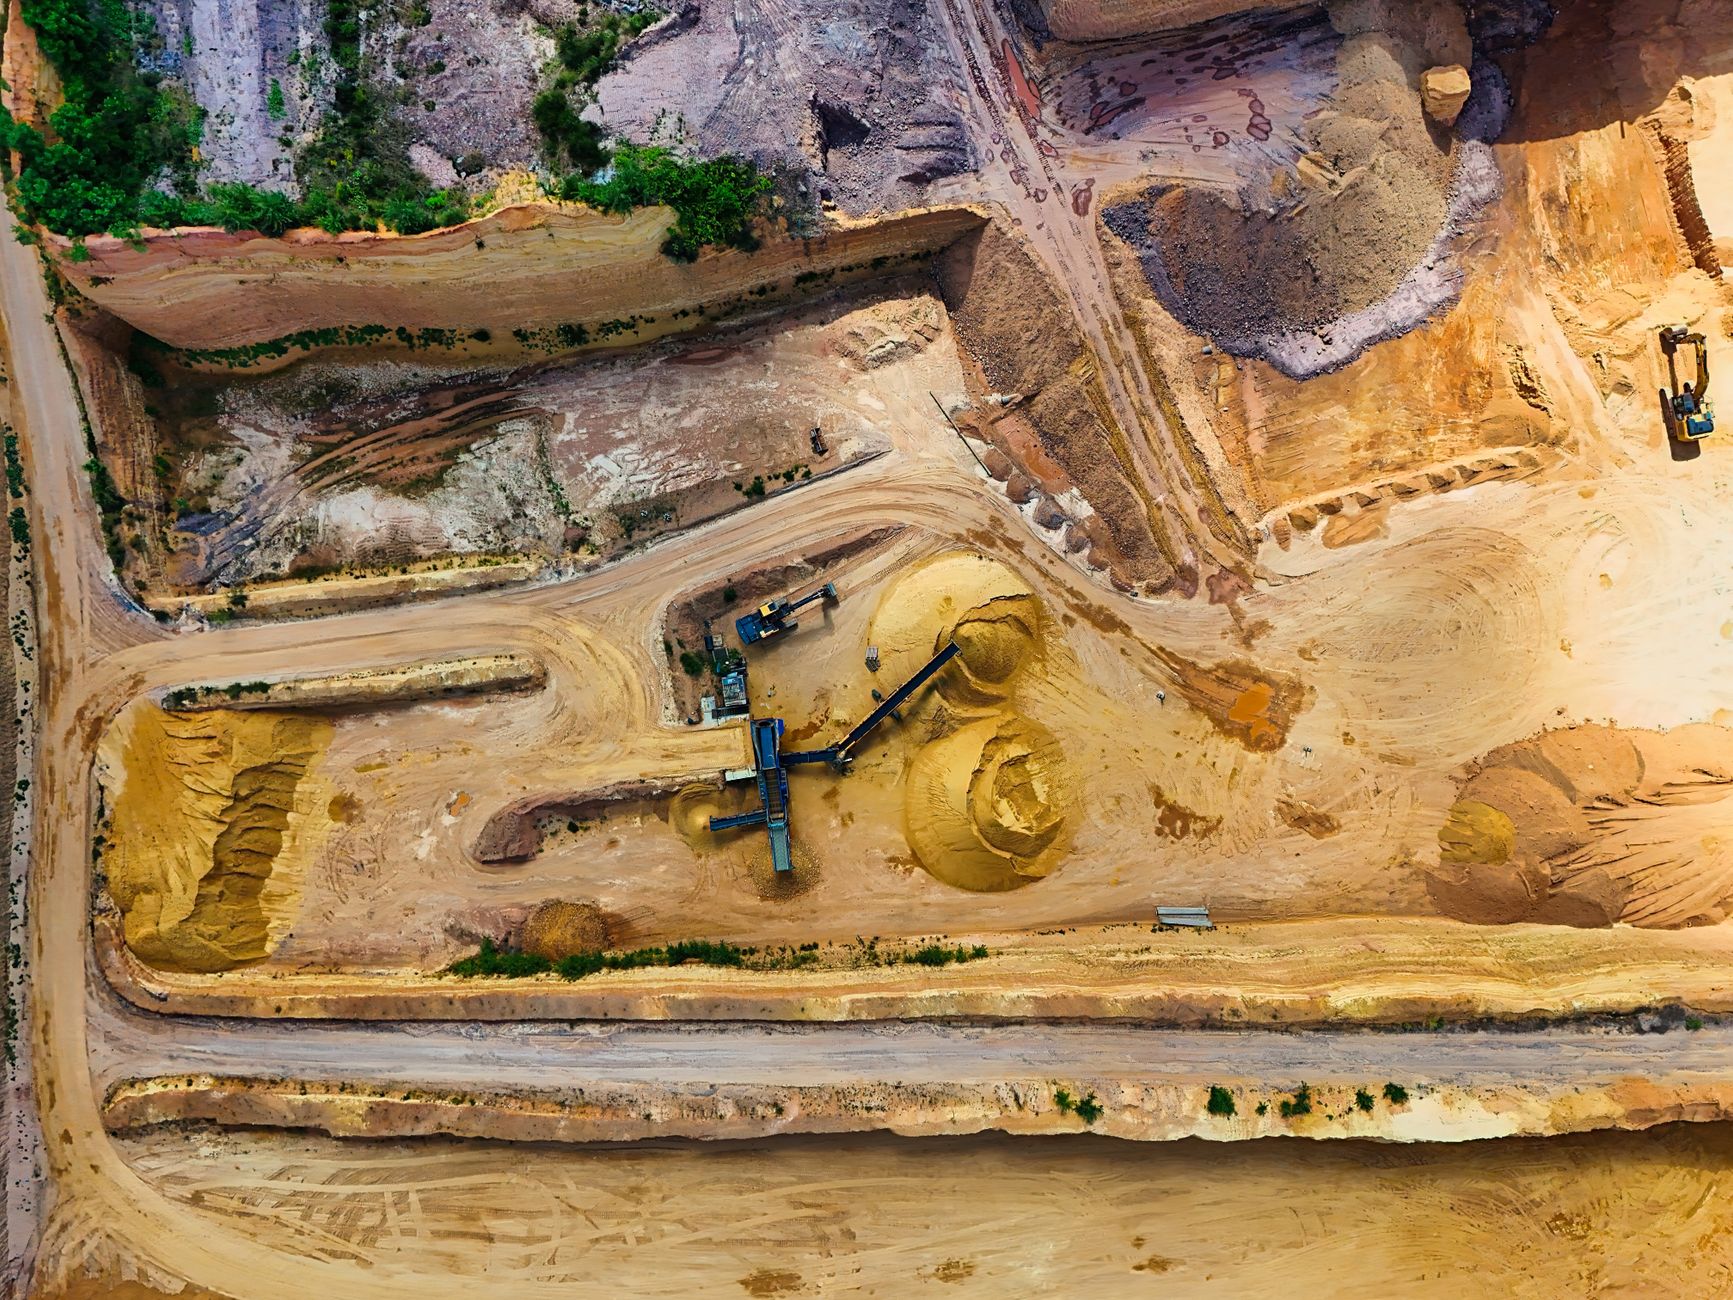
4 Best Canadian Iron Ore Stocks for July 2026
In 2021, Canada was the 7th largest exporter of iron ore in the world. Most of the iron ore in Canada is concentrated in Quebec and Newfoundland, and Labrador, and almost all the extracted ore is used by the global steelmaking industry. It's also reflected in the mine/project ownership, as two out o
![4 Best Canadian Iron Ore Stocks for [currentmonthyearfull]](https://lhajohzwizrsjmumhpjg.supabase.co/storage/v1/object/public/wealth-awesome/site-media/best-canadian-iron-ore-stocks_10-4-1024x538.jpg)
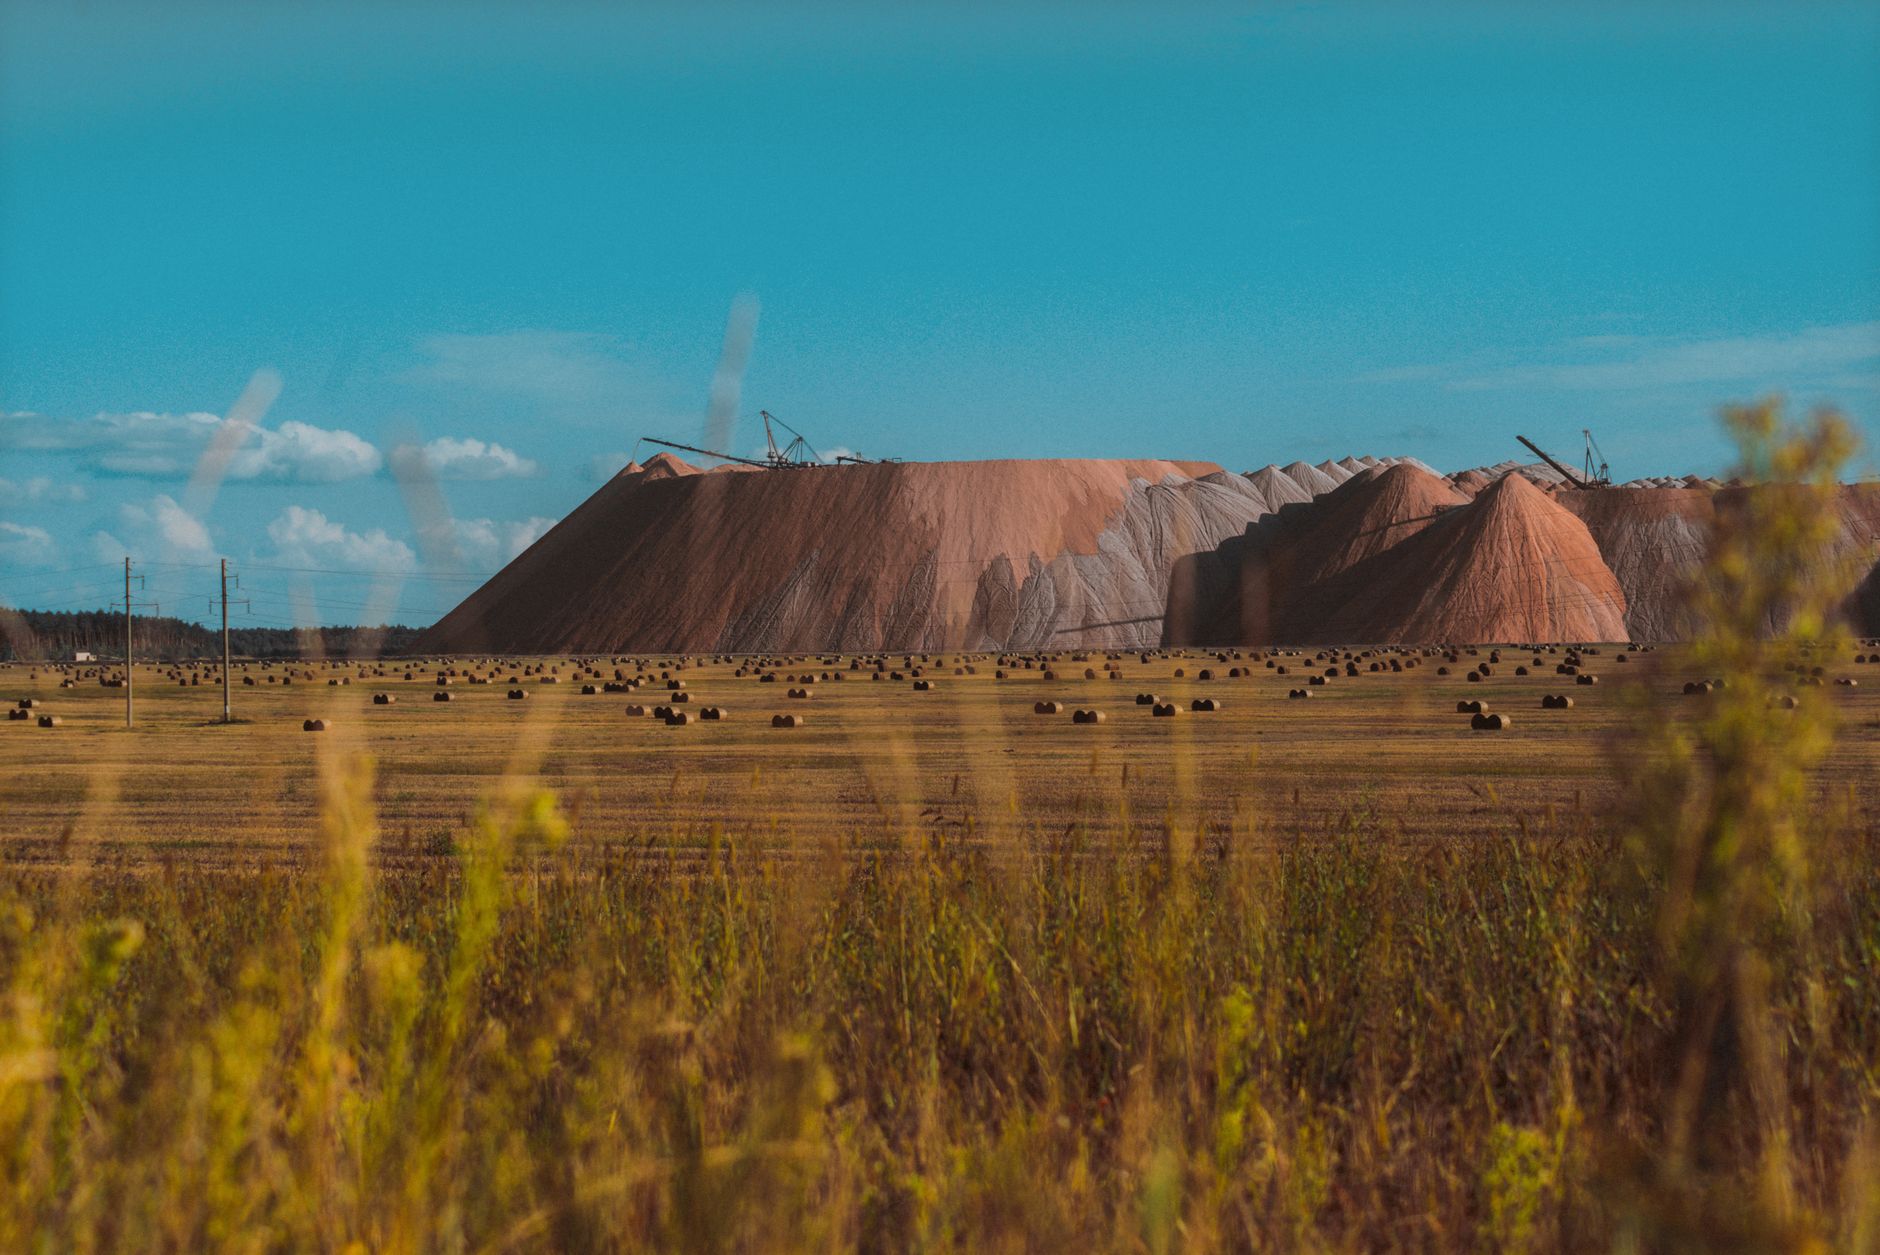
6 Best Potash Stocks In Canada (Jul 2026): A Core Fertilizer Ingredient
The world population is expected to reach 9.8 billion by 2050, and it will need at least 25% more food than we are producing today. That requires getting more out of the agricultural land, which will require significant advances in crop sciences and water management. But one key element that will re
![6 Best Potash Stocks In Canada ([currentmonthyear]): A Core Fertilizer Ingredient](https://lhajohzwizrsjmumhpjg.supabase.co/storage/v1/object/public/wealth-awesome/site-media/best-potash-stocks-in-canada_2-14.jpg)