Boralex Inc (BLX : TSX)
Common Stock
$37.04
CAD
+0.01 (0.03%)
Last updated: 2026-07-20
BLX
Boralex Inc
Performance
1 Day
+0.03%
1 Week
-0.03%
1 Month
+1.29%
YTD
+41.48%
Key Statistics
Market Cap
$3.81B
52W High
$37.18
52W Low
$23.23
P/E Ratio
-
50 Day MA
$36.91
200 Day MA
$30.76
Beta
-0.03
Dividend Yield
1.78%
Technical Indicators
Price vs 50-Day SMA
Price vs 200-Day SMA
Recent Price History
| Date | Open | High | Low | Close | Adj Close | Volume |
|---|---|---|---|---|---|---|
| 7/20/2026 | $37.06 | $37.06 | $37.02 | $37.04 | $37.04 | 150,495 |
| 7/17/2026 | $37.09 | $37.09 | $37.02 | $37.03 | $37.03 | 763,546 |
| 7/16/2026 | $37.00 | $37.08 | $37.00 | $37.01 | $37.01 | 907,518 |
| 7/15/2026 | $37.06 | $37.07 | $37.00 | $37.01 | $37.01 | 423,027 |
| 7/14/2026 | $37.00 | $37.07 | $37.00 | $37.02 | $37.02 | 434,499 |
| 7/13/2026 | $37.07 | $37.08 | $37.04 | $37.05 | $37.05 | 181,811 |
| 7/10/2026 | $36.97 | $37.07 | $36.97 | $37.04 | $37.04 | 133,841 |
| 7/9/2026 | $37.05 | $37.07 | $37.00 | $37.00 | $37.00 | 270,599 |
| 7/8/2026 | $36.97 | $37.08 | $36.97 | $37.07 | $37.07 | 155,724 |
| 7/7/2026 | $37.00 | $37.04 | $37.00 | $37.00 | $37.00 | 223,128 |
Analyst Price Targets
Based on analyst covering BLX
Wall Street analysts forecast BLX stock price to rise 0.6% over the next 12 months.
Consensus
NeutralBased on avg. target vs last close (formal rating unavailable for Canadian listings)
Avg. Target
C$37.25
+0.6% Upside
Current Price
C$37.04
Last close
Analyst ratings and price targets are updated periodically. Not financial advice.
Wealth Awesome Price Forecast
WA ModelStatistical 90-day price range based on BLX's historical volatility
30-Day Vol
3.9%
Annualized
90-Day Vol
26.6%
Annualized
Trend (90d)
+2.7%
Annualized drift
90d Mean
C$37.40
Expected price
| Horizon | Expected | 68% Range (1σ) |
|---|---|---|
| 30 trading days | C$37.16 | C$36.66 – C$37.67 |
| 60 trading days | C$37.28 | C$36.57 – C$38.00 |
| 90 trading days | C$37.40 | C$36.54 – C$38.29 |
Methodology: Range is calculated using 30-day realized volatility via geometric Brownian motion (log-normal model). 68% band = ±1σ, 95% band = ±2σ. This is a statistical model, not a prediction. Past volatility does not guarantee future results. Not financial advice.
About Boralex Inc
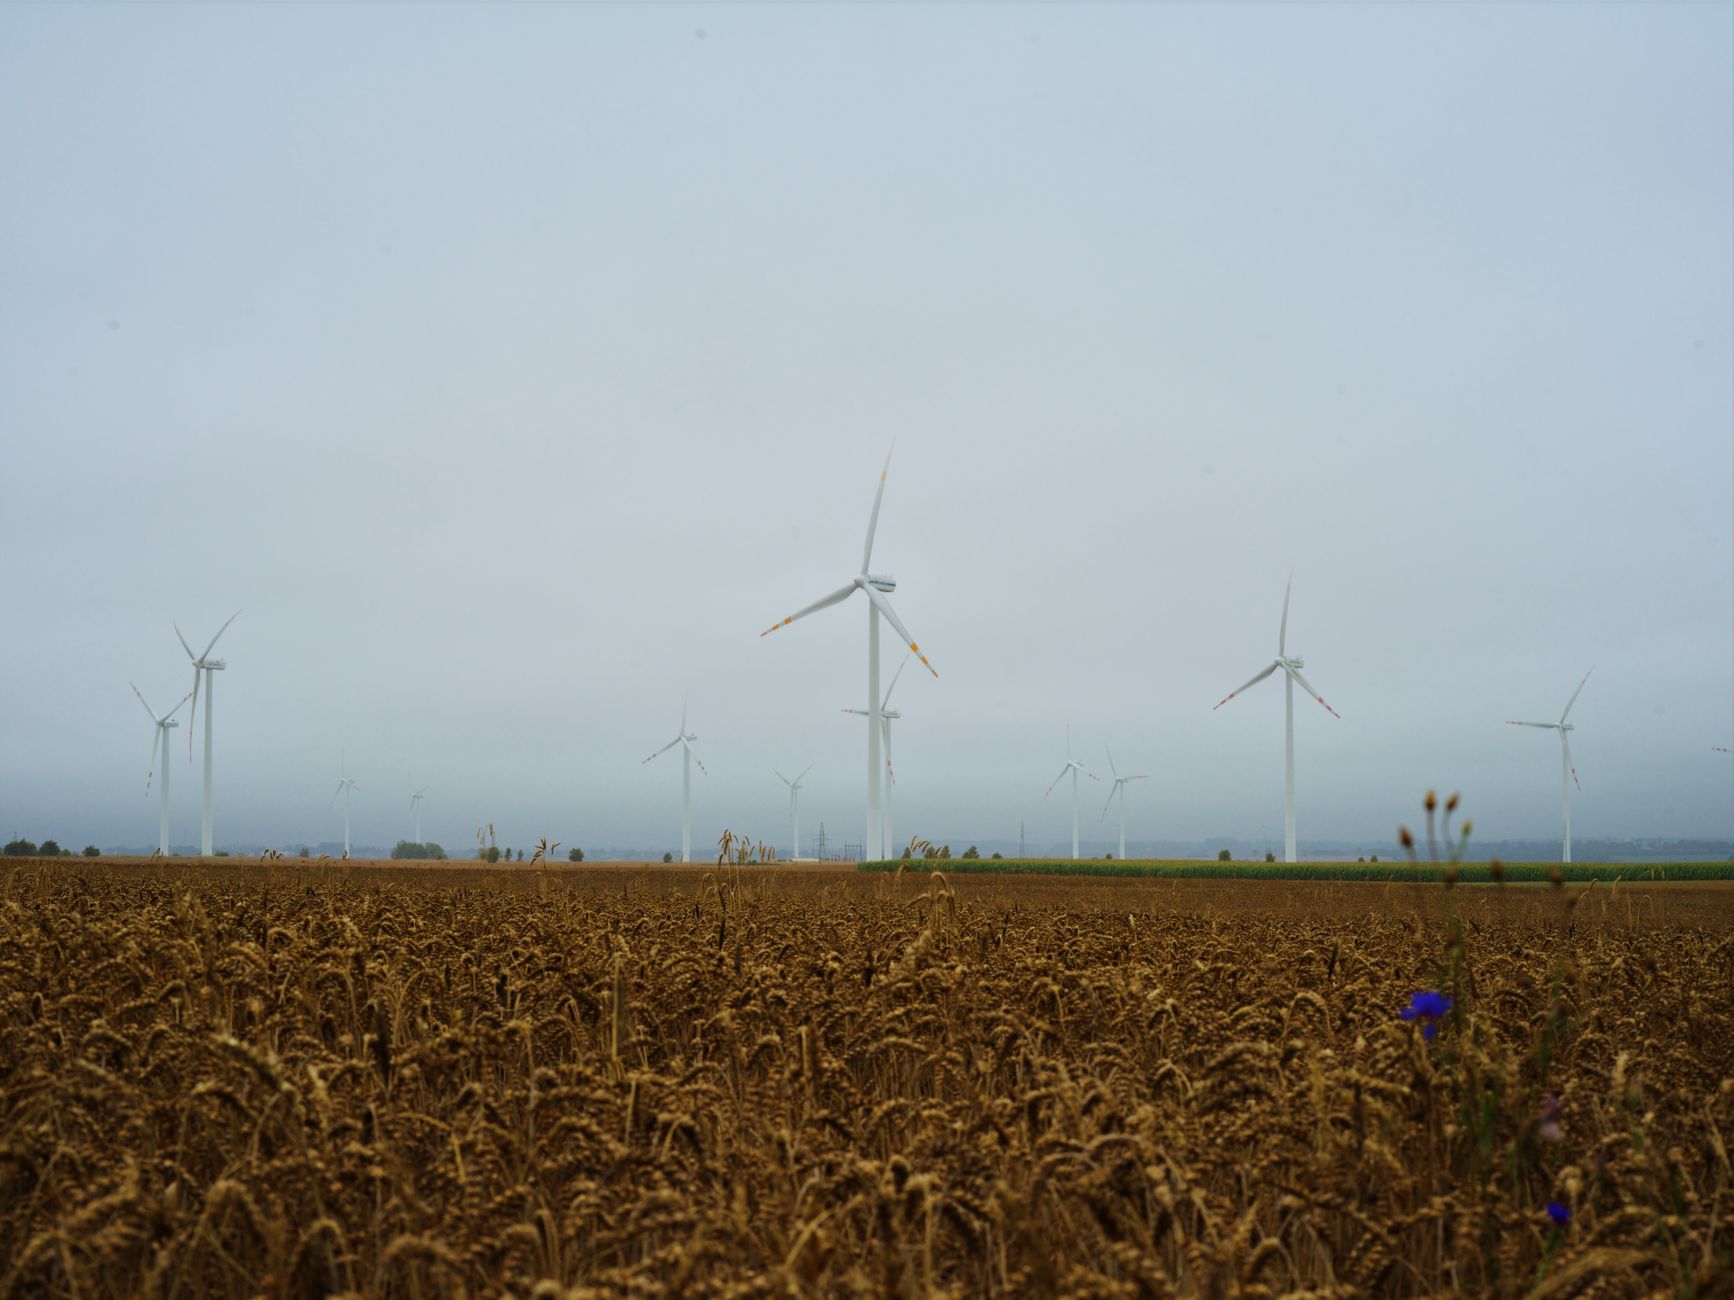
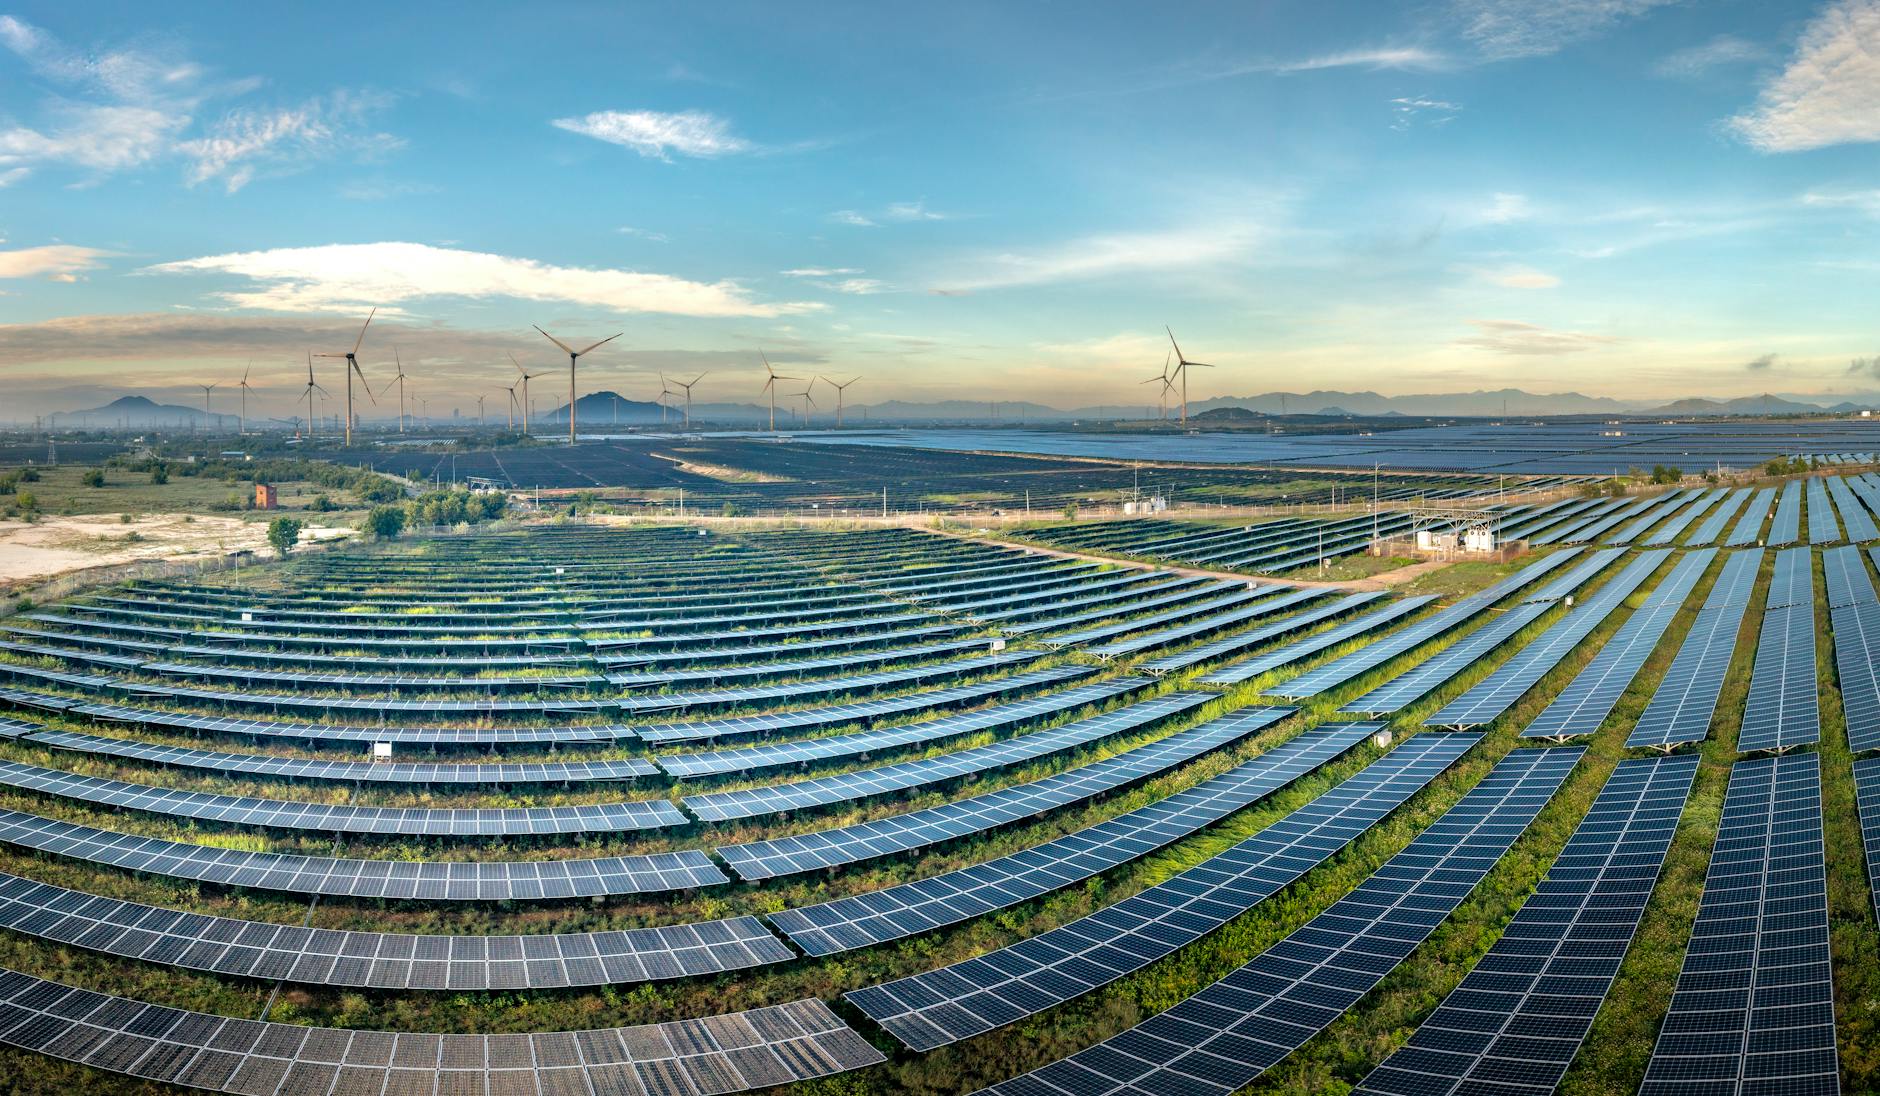
Boralex Inc., together with its subsidiaries, engages in the developing, building, and operating power generating and storage facilities in Canada, France, the United States, and the United Kingdom. The company generates electricity from wind, solar, and hydroelectric resources. As of December 31, 2025, the company operates 107 wind farms; 13 solar power stations; 15 hydroelectric power stations; and 4 battery energy storage systems with an installed capacity of 2,299 megawatts (MW) in North America and 1,484 MW in Europe. Boralex Inc. was incorporated in 1982 and is headquartered in Kingsey Falls, Canada.
Financials
- Revenue (TTM)
- $898.00M
- EBITDA
- $512.00M
- Profit Margin
- -3.56%
- ROE (TTM)
- 0.05%
- EPS (Diluted)
- -0.31
- Book Value
- 14.82
Classification
- Sector
- Utilities
- Industry
- Independent Power and Renewable Electricity Producers
- Group
- Utilities
💰 Recent Dividends
$0.1650
Ex: May 29, 2026
$0.1650
Ex: Feb 27, 2026
$0.1650
Ex: Nov 28, 2025
Pay: Dec 15
$0.1650
Ex: Aug 29, 2025
Pay: Sep 15
$0.1650
Ex: May 30, 2025
Pay: Jun 16
$0.1650
Ex: Feb 28, 2025
Pay: Mar 17
$0.1650
Ex: Nov 29, 2024
Pay: Dec 16
$0.5000
Ex: Nov 8, 2024
Pay: Nov 26
$0.1650
Ex: Aug 30, 2024
Pay: Sep 17
$0.5000
Ex: Aug 5, 2024
Pay: Aug 20
Advertisement
7 stocks to buy and hold forever
Blue-chip dividend stocks for long-term wealth building.
Get the FREE ReportExplore More
Common Questions About BLX
Articles Featuring BLX.TO
Latest articles and analysis covering BLX.TO
What's Going On With Boralex Inc Stock Monday?
Boralex Inc's stock has seen slight movement this week, closing at C$37.04. The company is involved in significant financing and acquisition activities that could shape its future in the renewable energy sector.
What's Going On With Boralex Inc Stock Tuesday?
Boralex Inc's stock has shown stability this week, with a slight increase following the announcement of a significant financing initiative in France. The utility company's performance metrics suggest a cautious optimism among investors.

Boralex's $6.5 Billion Buyout Approved: What It Means for Canadian Energy
Boralex's acquisition by Brookfield and La Caisse has gained court approval, paving the way for a transformative shift in the Canadian renewable energy sector.
Boralex's C$9B Sale to Brookfield and La Caisse Secures Court Approval
Boralex secures court approval for its C$9 billion sale to Brookfield and La Caisse, paving the way for future growth in the renewable energy sector.
Boralex Secures Overwhelming Shareholder Approval for Brookfield and La Caisse Deal
Boralex shareholders have overwhelmingly approved the acquisition by Brookfield and La Caisse, paving the way for enhanced growth opportunities in renewable energy.

What’s Next for Boralex Inc. (BLX.TO) After Strategic Review Announcement?
Boralex Inc. is preparing to announce earnings, but the spotlight is on its strategic review process, raising questions about future direction and shareholder value.

8 Best Utility Stocks in Canada for July 2026
Are you looking to invest your money in Canadian utility companies but don’t know where to start? The utility sector as a whole had a market capitalization, or total market value, of more than $1.58 trillion US dollars. Individuals that invest in publicly-traded utility companies typically do so for
![8 Best Utility Stocks in Canada for [currentmonthyearfull]](https://lhajohzwizrsjmumhpjg.supabase.co/storage/v1/object/public/wealth-awesome/site-media/best-utility-stocks-in-canada_11-4-1024x538.jpg)