Cameco Corp (CCO : TSX)
Common Stock
$119.23
CAD
-0.70 (-0.58%)
Last updated: 2026-07-20
CCO
Cameco Corp
Performance
1 Day
-0.58%
1 Week
-6.61%
1 Month
-21.08%
YTD
-11.92%
Key Statistics
Market Cap
$52.23B
52W High
$182.72
52W Low
$95.41
P/E Ratio
81.03
50 Day MA
$146.00
200 Day MA
$144.96
Beta
1.00
Dividend Yield
0.20%
Technical Indicators
Price vs 50-Day SMA
Price vs 200-Day SMA
Recent Price History
| Date | Open | High | Low | Close | Adj Close | Volume |
|---|---|---|---|---|---|---|
| 7/20/2026 | $120.17 | $120.41 | $118.62 | $119.23 | $119.23 | 1,193,889 |
| 7/17/2026 | $119.50 | $121.55 | $116.44 | $119.93 | $119.93 | 1,025,041 |
| 7/16/2026 | $125.51 | $125.52 | $121.46 | $122.71 | $122.71 | 1,585,294 |
| 7/15/2026 | $129.98 | $130.90 | $125.54 | $127.69 | $127.69 | 800,496 |
| 7/14/2026 | $129.01 | $130.80 | $128.26 | $128.87 | $128.87 | 880,655 |
| 7/13/2026 | $133.21 | $134.00 | $126.27 | $127.67 | $127.67 | 1,707,389 |
| 7/10/2026 | $136.36 | $138.08 | $134.69 | $135.97 | $135.97 | 585,484 |
| 7/9/2026 | $135.25 | $137.02 | $134.75 | $135.79 | $135.79 | 1,096,509 |
| 7/8/2026 | $132.35 | $134.43 | $129.93 | $134.26 | $134.26 | 1,281,605 |
| 7/7/2026 | $135.57 | $136.48 | $132.00 | $134.43 | $134.43 | 1,101,174 |
Analyst Price Targets
Based on analyst covering CCO
Wall Street analysts forecast CCO stock price to rise 49.9% over the next 12 months.
Consensus
BullishBased on avg. target vs last close (formal rating unavailable for Canadian listings)
Avg. Target
C$178.78
+49.9% Upside
Current Price
C$119.23
Last close
Analyst ratings and price targets are updated periodically. Not financial advice.
Wealth Awesome Price Forecast
WA ModelStatistical 90-day price range based on CCO's historical volatility
30-Day Vol
46.1%
Annualized
90-Day Vol
51.6%
Annualized
Trend (90d)
-50.0%
Annualized drift
90d Mean
C$99.73
Expected price
| Horizon | Expected | 68% Range (1σ) |
|---|---|---|
| 30 trading days | C$112.34 | C$95.81 – C$131.72 |
| 60 trading days | C$105.85 | C$84.52 – C$132.56 |
| 90 trading days | C$99.73 | C$75.70 – C$131.38 |
Methodology: Range is calculated using 30-day realized volatility via geometric Brownian motion (log-normal model). 68% band = ±1σ, 95% band = ±2σ. This is a statistical model, not a prediction. Past volatility does not guarantee future results. Not financial advice.
About Cameco Corp
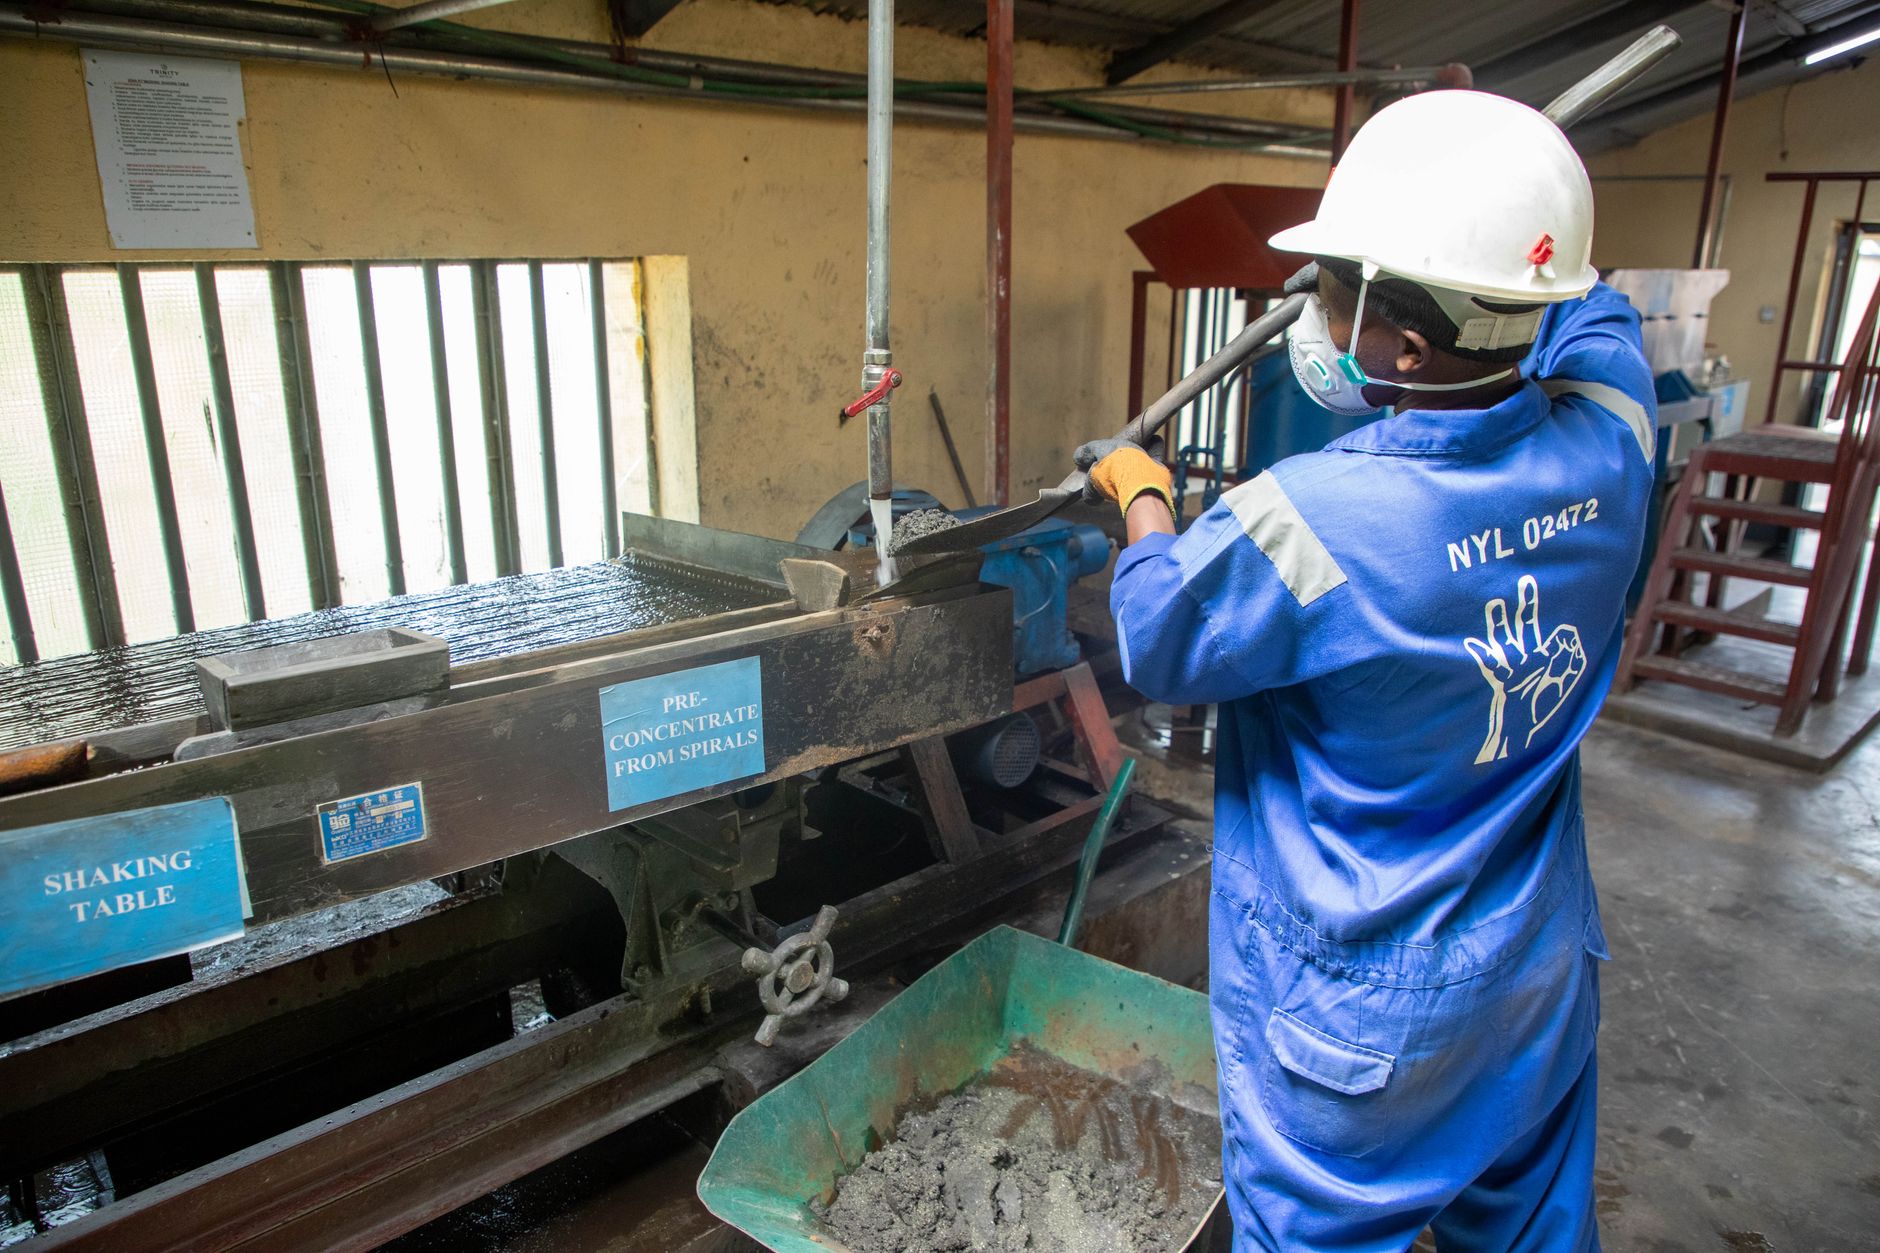
Cameco Corporation provides uranium for the generation of electricity in the Americas, Europe, and Asia. It operates in three segments: Uranium, Fuel Services, and Westinghouse. The Uranium segment engages in the exploration for, mining, milling, purchase, and sale of uranium concentrate. Its Fuel Services segment is involved in the refining, conversion, and fabrication of uranium concentrate, as well as purchase and sale of conversion services. The Westinghouse segment operates as a nuclear reactor technology original equipment manufacturer and a provider of products and services to commercial utilities and government agencies. It also provides outage and maintenance, engineering support, instrumentation and controls equipment, and plant modification services, as well as components and parts to nuclear reactors. The company sells its uranium and fuel products and services to nuclear utilities. Cameco Corporation was incorporated in 1987 and is headquartered in Saskatoon, Canada.
Financials
- Revenue (TTM)
- $3.54B
- EBITDA
- $893.91M
- Profit Margin
- 18.39%
- ROE (TTM)
- 9.60%
- EPS (Diluted)
- 1.48
- Book Value
- 16.22
Classification
- Sector
- Energy
- Industry
- Oil, Gas & Consumable Fuels
- Group
- Energy
💰 Recent Dividends
$0.2400
Ex: Dec 1, 2025
Pay: Dec 16
$0.1600
Ex: Nov 27, 2024
Pay: Dec 13
$0.1200
Ex: Nov 29, 2023
Pay: Dec 15
Advertisement
7 stocks to buy and hold forever
Blue-chip dividend stocks for long-term wealth building.
Get the FREE ReportExplore More
Common Questions About CCO
Articles Featuring CCO.TO
Latest articles and analysis covering CCO.TO
Cameco Corp. (CCO.TO) Faces Weekly Setback Amid Operational Challenges
Cameco Corp. has seen a 5% decline over the past week, driven by operational disruptions at its Cigar Lake mine, raising concerns about production stability.
What's Going On With Cameco Corp Stock Monday?
Cameco Corp's stock has dropped this week, closing at C$119.23, reflecting a broader trend of uncertainty in the energy sector. Despite recent operational updates, investors are cautious as the stock continues to trade well below its moving averages.

Why Cameco Corp stock is sliding today
Cameco Corp's stock has experienced a notable decline of 2.08% in the latest trading session, closing at CA$120.16. Despite recent operational recoveries, investors are wary of the company's high valuation amidst fluctuating market conditions.

What's Going On With Cameco Corp Stock Tuesday?
Cameco Corp has faced a challenging week, with its stock price dropping significantly amid broader market dynamics. As investors assess the company's prospects, understanding the technical indicators and market sentiment will be crucial.
Why Cameco Corp stock is plummeting today
Cameco Corp's stock has experienced a significant decline of 6.16% in the last trading session, reflecting broader market concerns despite bullish forecasts for uranium prices in the coming years.
Why Cameco Corp stock is sliding today
Cameco Corp's stock has dropped 4.12% today, closing at CA$138.61, primarily due to operational challenges at its Cigar Lake mine. Investors are concerned about the potential impact on production and future earnings.

Why Cameco Corp stock is tanking today
Cameco Corp's stock fell 1.61% today, driven by operational challenges at its Cigar Lake mine and a broader market sentiment that may affect future performance.
Why Cameco Corp stock is sliding today
Cameco Corp's stock slid 2.22% in the last trading session, closing at CA$143.66. This decline raises questions about the sustainability of its recent performance despite impressive earnings growth.

Why Cameco Corp stock is sliding today
Cameco Corp's stock slid 2.62% today, reflecting investor caution amidst competitive pressures in the uranium sector, despite the company's strategic positioning in the nuclear energy landscape.

Why Cameco Corp stock is rising today
Cameco Corp's stock gained 2.04% in the last trading session, driven by strong fundamentals and a favorable market outlook for uranium as a key energy source.

Why Cameco Corp stock is gaining today
Cameco Corp's stock has gained 0.78% as investors react positively to the company's strong fundamentals and the growing global demand for nuclear energy. With a solid contract portfolio and increasing uranium prices, Cameco is well-positioned for future growth.

Why Cameco Corp stock is tanking today
Cameco Corp's stock has taken a hit, closing down 1.15% as operational challenges and mixed analyst recommendations weigh on investor sentiment. While the long-term outlook for uranium remains bullish, short-term uncertainties could impact stock performance.

Why Cameco Corp stock is skyrocketing today
Cameco Corp's stock has soared by 6.36% today, driven by a favorable market environment for uranium as countries commit to expanding nuclear energy capacity. Investors are optimistic about Cameco's strategic positioning and long-term growth potential.

Why Cameco Corp stock is plummeting today
Cameco Corp's stock has plummeted by 6.85% today, raising alarms about its valuation and future prospects in the uranium market. As the company faces increasing scrutiny, investors must consider the implications of this significant decline.

Why Cameco Corp stock is plummeting today
Cameco Corp's stock has plummeted by 9.06% today, raising questions about its valuation and future earnings potential. With analysts suggesting the stock may be overvalued, investors are advised to proceed with caution.

Cameco Boosts Cigar Lake Stake: What It Means for Canadian Uranium Investors
Cameco's move to acquire a larger stake in Cigar Lake raises important questions for investors about operational risks and future production strategies in the uranium sector.
Cameco Corp Rises 5% in One Day as Nuclear Demand Surges
Cameco Corp's stock surged 5% in the last session, buoyed by optimism in the nuclear sector and strong earnings expectations.
Why Cameco Stock Is Surging an Incredible 20%
Ticker: CCO.TO | Sector: Energy | Industry: Uranium 🌍 Official Website: https://www.cameco.com 📊 Wealth Awesome Stock Page: https://wealthawesome.com/stock/cco-to/ Cameco (TSX: CCO) continues to light up the markets with massive momentum in 2025 — rising over 90% year-to-date and recently surging
What is the salary of Cameco Corp CEO?
Tim Gitzel has served as CEO of Cameco Corp since 2011, leading one of the world’s largest uranium producers through a period of resurgence for nuclear energy. With more than three decades of experience in the nuclear industry, Gitzel has positioned Cameco as a key player in the global push for low-

Top 60 CEO Salaries in Canada
From banking and telecommunications to mining, retail, and renewable energy, Canada’s leading CEOs command immense responsibilities—and compensation packages to match. These executives steer the country’s top publicly traded companies, influencing economies and innovation across the TSX Composite In
Showing latest 20 articles