Geodrill Limited (GEO : TSX)
Common Stock
$2.54
CAD
-0.06 (-2.31%)
Last updated: 2026-07-20
GEO
Geodrill Limited
Performance
1 Day
-2.31%
1 Week
-4.51%
1 Month
-9.29%
YTD
-38.80%
Key Statistics
Market Cap
$123.53M
52W High
$4.29
52W Low
$2.50
P/E Ratio
-
50 Day MA
$2.80
200 Day MA
$3.36
Beta
0.65
Dividend Yield
-
Technical Indicators
Price vs 50-Day SMA
Price vs 200-Day SMA
Recent Price History
| Date | Open | High | Low | Close | Adj Close | Volume |
|---|---|---|---|---|---|---|
| 7/20/2026 | $2.53 | $2.57 | $2.53 | $2.54 | $2.54 | 7,131 |
| 7/17/2026 | $2.62 | $2.62 | $2.59 | $2.60 | $2.60 | 2,950 |
| 7/16/2026 | $2.70 | $2.70 | $2.60 | $2.65 | $2.65 | 2,336 |
| 7/15/2026 | $2.79 | $2.79 | $2.65 | $2.73 | $2.73 | 4,082 |
| 7/14/2026 | $2.70 | $2.72 | $2.67 | $2.72 | $2.72 | 1,400 |
| 7/13/2026 | $2.70 | $2.76 | $2.66 | $2.66 | $2.66 | 8,622 |
| 7/10/2026 | $2.65 | $2.74 | $2.65 | $2.74 | $2.74 | 6,067 |
| 7/9/2026 | $2.64 | $2.65 | $2.64 | $2.65 | $2.65 | 3,766 |
| 7/8/2026 | $2.60 | $2.67 | $2.55 | $2.64 | $2.64 | 7,700 |
| 7/7/2026 | $2.64 | $2.64 | $2.53 | $2.60 | $2.60 | 14,664 |
Analyst Price Targets
Based on analyst covering GEO
Wall Street analysts forecast GEO stock price to rise 54.6% over the next 12 months.
Consensus
BullishBased on avg. target vs last close (formal rating unavailable for Canadian listings)
Avg. Target
C$3.93
+54.6% Upside
Current Price
C$2.54
Last close
Analyst ratings and price targets are updated periodically. Not financial advice.
Wealth Awesome Price Forecast
WA ModelStatistical 90-day price range based on GEO's historical volatility
30-Day Vol
44.8%
Annualized
90-Day Vol
44.8%
Annualized
Trend (90d)
-50.0%
Annualized drift
90d Mean
C$2.12
Expected price
| Horizon | Expected | 68% Range (1σ) |
|---|---|---|
| 30 trading days | C$2.39 | C$2.05 – C$2.79 |
| 60 trading days | C$2.25 | C$1.81 – C$2.81 |
| 90 trading days | C$2.12 | C$1.63 – C$2.78 |
Methodology: Range is calculated using 30-day realized volatility via geometric Brownian motion (log-normal model). 68% band = ±1σ, 95% band = ±2σ. This is a statistical model, not a prediction. Past volatility does not guarantee future results. Not financial advice.
About Geodrill Limited
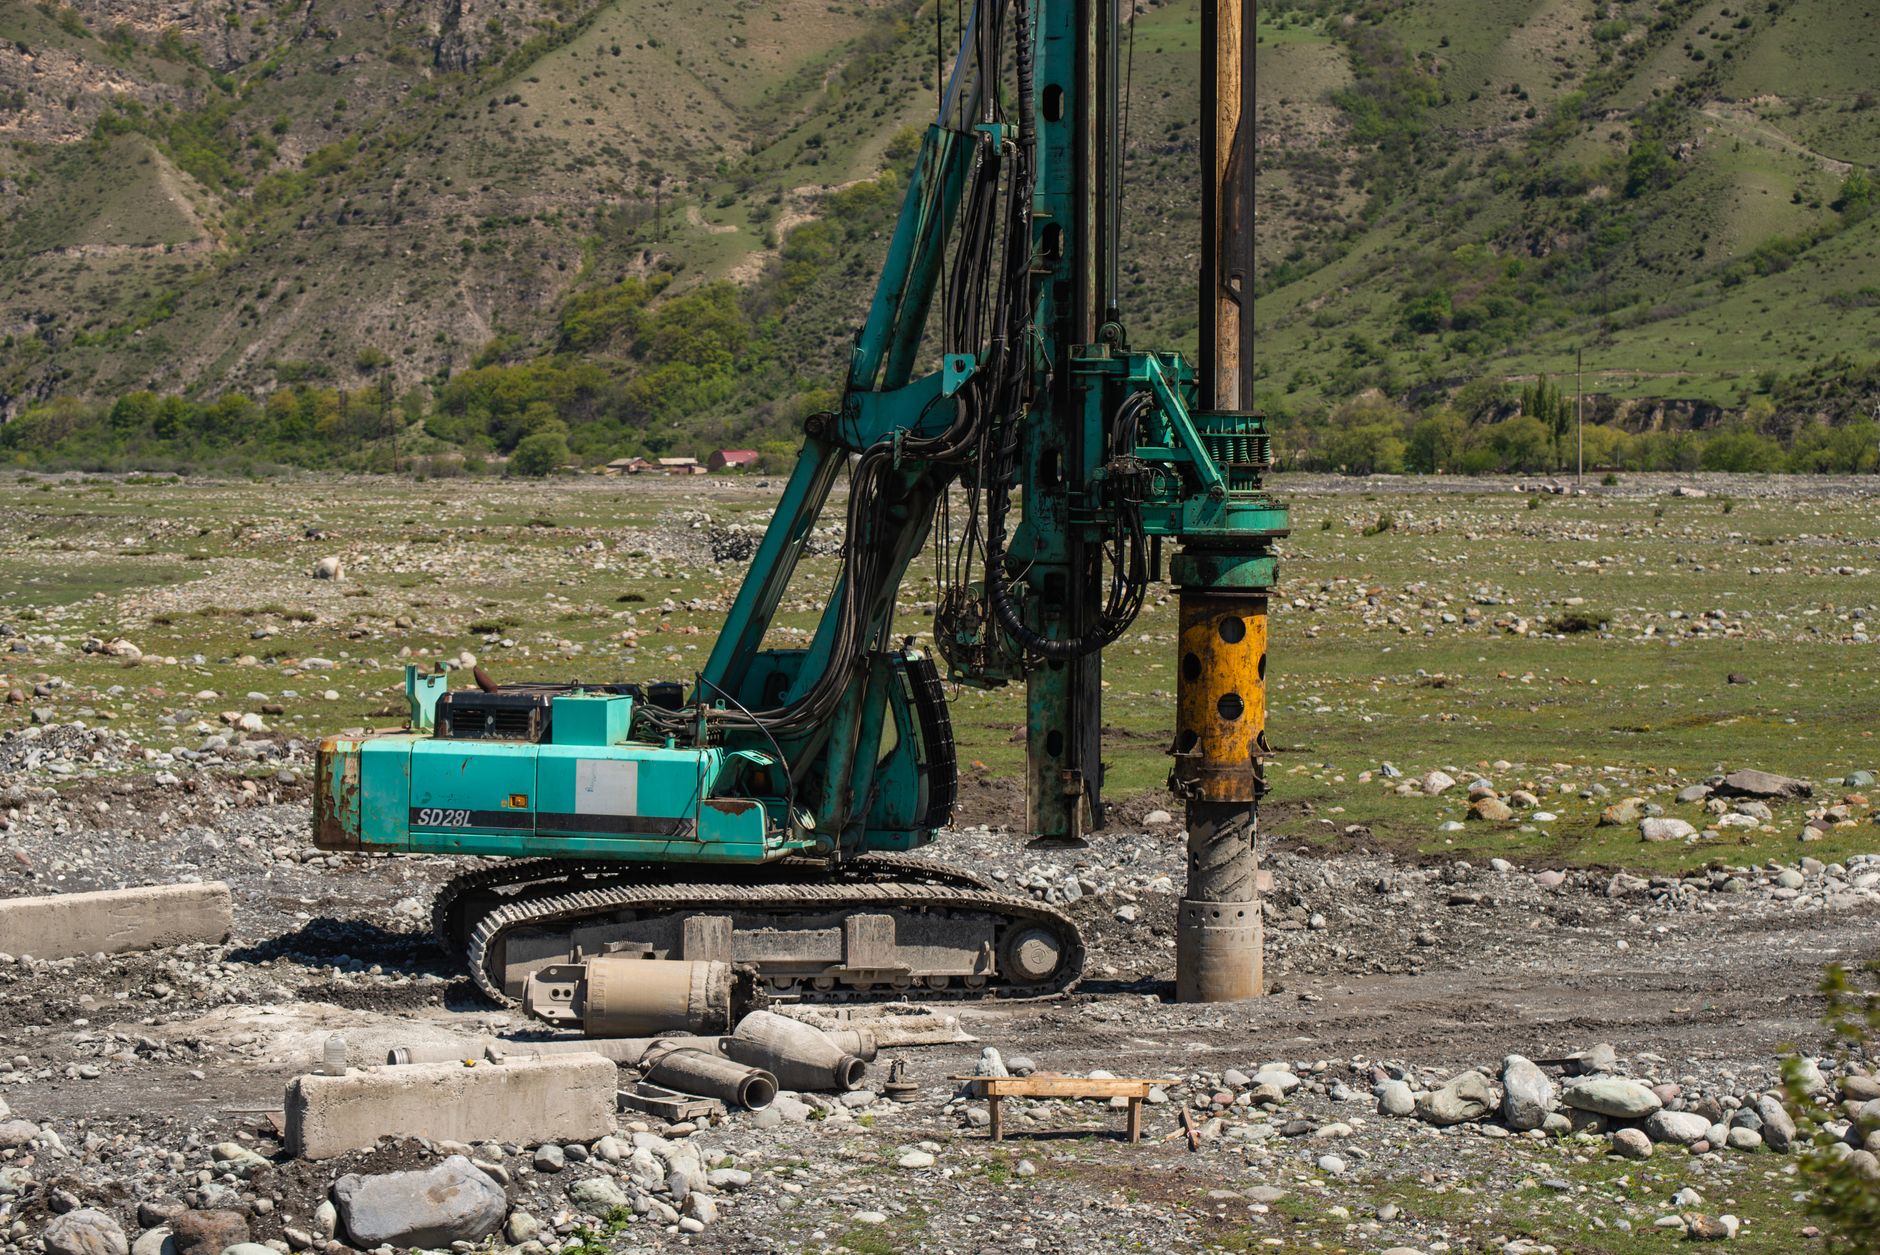
Geodrill Limited, together with its subsidiaries, provides mineral exploration drilling services to the mining companies in West Africa, Egypt, Chile, and Peru. The company offers reverse circulation, core, air-core, deep directional Navi, water borehole, and underground drilling services, as well as reverse circulation grade control services. It operates multi-purpose, core, air-core, grade control, and underground drill rigs; boosters and auxiliary compressors; and various support vehicles, as well as crawler-mounted rod carriers, and ancillary equipment. Geodrill Limited was incorporated in 1998 and is headquartered in Douglas, Isle of Man.
Financials
- Revenue (TTM)
- $184.59M
- EBITDA
- $22.41M
- Profit Margin
- -3.93%
- ROE (TTM)
- -6.22%
- EPS (Diluted)
- -0.21
- Book Value
- 3.50
Classification
- Sector
- Materials
- Industry
- Metals & Mining
- Group
- Materials
Advertisement
7 stocks to buy and hold forever
Blue-chip dividend stocks for long-term wealth building.
Get the FREE ReportExplore More
Common Questions About GEO
Articles Featuring GEO.TO
Latest articles and analysis covering GEO.TO
What's Going On With Geodrill Limited Stock Tuesday?
Geodrill Limited's stock has faced significant pressure in recent weeks, with a notable decline in its share price reflecting mixed financial results and broader market conditions. Investors await upcoming earnings reports for further insights.

What's Going On With Geodrill Limited Stock Wednesday?
Geodrill Limited's stock has seen a modest uptick this week amidst a backdrop of mixed financial results. Despite the positive price movement, the company's financial performance presents challenges that investors should consider.

Why Geodrill Limited stock is rising today
Geodrill Limited's stock rose by 2.26% in the last trading session, closing at CA$2.71. This uptick comes as the company faces financial hurdles, including a recent net loss in its quarterly results.

Why Geodrill Limited stock is sliding today
Geodrill Limited's stock slid 2.23% today, closing at CA$2.63, amid investor concerns about its operational performance and market conditions.

Why Geodrill Limited stock is gaining today
Geodrill Limited's stock has gained 1.92% in the last trading session, closing at CA$2.65. This uptick reflects a potential shift in investor sentiment towards the mining and drilling sector, despite the company's recent financial challenges.

Why Geodrill Limited stock is plummeting today
Geodrill Limited's stock has plummeted 8.21% today, closing at CA$2.57. This drop highlights investor apprehension regarding the company's financial health, especially after reporting a net loss in Q1 2026.
Why Geodrill Limited stock is tanking today
Geodrill Limited's stock has dropped 1.74% today, closing at CA$2.82. The company's recent financial performance raises questions about its future profitability.

Why Geodrill Limited stock is tanking today
Geodrill Limited's stock has dropped 1.71% in the latest session, raising concerns among investors about its financial health and future prospects.

Why Geodrill Limited stock is plummeting today
Geodrill Limited's stock plummeted by 5.41% today, closing at CA$2.80. This decline raises questions about the company's stability in a competitive mining services market.