Keyera Corp. (KEY : TSX)
Common Stock
$59.05
CAD
-0.90 (-1.50%)
Last updated: 2026-07-20
KEY
Keyera Corp.
Performance
1 Day
-1.50%
1 Week
+1.08%
1 Month
+4.59%
YTD
+32.37%
Key Statistics
Market Cap
$17.59B
52W High
$60.30
52W Low
$38.85
P/E Ratio
75.89
50 Day MA
$57.06
200 Day MA
$49.64
Beta
0.82
Dividend Yield
3.62%
Technical Indicators
Price vs 50-Day SMA
Price vs 200-Day SMA
Recent Price History
| Date | Open | High | Low | Close | Adj Close | Volume |
|---|---|---|---|---|---|---|
| 7/20/2026 | $59.74 | $60.30 | $59.02 | $59.05 | $59.05 | 499,217 |
| 7/17/2026 | $59.89 | $60.14 | $59.43 | $59.95 | $59.95 | 1,047,607 |
| 7/16/2026 | $58.74 | $59.52 | $58.59 | $59.19 | $59.19 | 1,302,600 |
| 7/15/2026 | $58.56 | $59.16 | $58.34 | $58.81 | $58.81 | 540,076 |
| 7/14/2026 | $58.58 | $58.67 | $58.00 | $58.62 | $58.62 | 648,249 |
| 7/13/2026 | $58.00 | $58.76 | $57.87 | $58.42 | $58.42 | 1,557,660 |
| 7/10/2026 | $58.11 | $58.22 | $56.83 | $57.38 | $57.38 | 1,328,439 |
| 7/9/2026 | $58.99 | $59.16 | $57.96 | $58.25 | $58.25 | 778,598 |
| 7/8/2026 | $58.05 | $59.20 | $57.83 | $59.12 | $59.12 | 1,204,889 |
| 7/7/2026 | $56.57 | $57.64 | $56.36 | $57.36 | $57.36 | 932,263 |
Analyst Price Targets
Based on analyst covering KEY
Wall Street analysts forecast KEY stock price to rise 7.2% over the next 12 months.
Consensus
Moderately BullishBased on avg. target vs last close (formal rating unavailable for Canadian listings)
Avg. Target
C$63.29
+7.2% Upside
Current Price
C$59.05
Last close
Analyst ratings and price targets are updated periodically. Not financial advice.
Wealth Awesome Price Forecast
WA ModelStatistical 90-day price range based on KEY's historical volatility
30-Day Vol
23.1%
Annualized
90-Day Vol
27.2%
Annualized
Trend (90d)
+50.0%
Annualized drift
90d Mean
C$70.59
Expected price
| Horizon | Expected | 68% Range (1σ) |
|---|---|---|
| 30 trading days | C$62.67 | C$57.88 – C$67.86 |
| 60 trading days | C$66.52 | C$59.44 – C$74.44 |
| 90 trading days | C$70.59 | C$61.51 – C$81.02 |
Methodology: Range is calculated using 30-day realized volatility via geometric Brownian motion (log-normal model). 68% band = ±1σ, 95% band = ±2σ. This is a statistical model, not a prediction. Past volatility does not guarantee future results. Not financial advice.
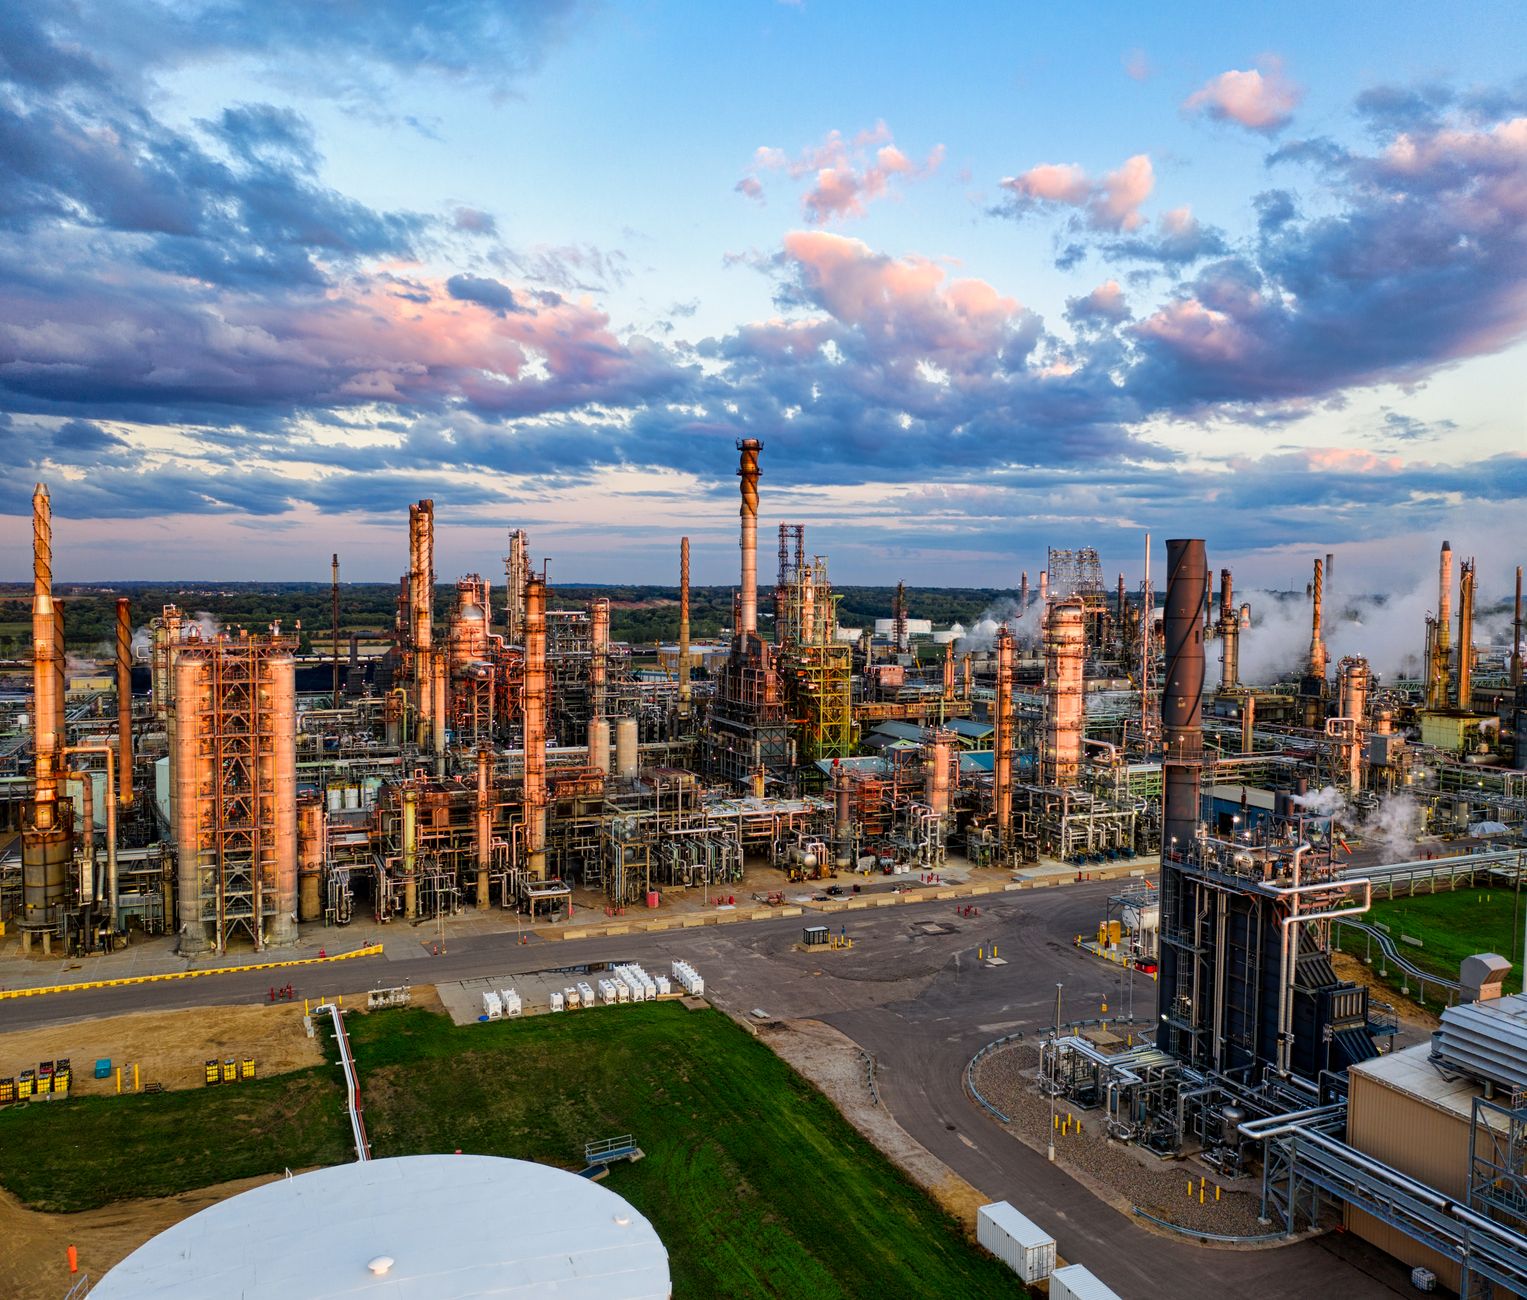
About Keyera Corp.
Keyera Corp. together with its subsidiaries, engages in the gathering and processing of natural gas; and the transportation, storage, and marketing of natural gas liquids and iso-octane in Canada and the United States. It operates through three segments: Gathering and Processing, Liquids Infrastructure, and Marketing. The Gathering and Processing segment owns and operates raw gas gathering pipelines and processing plants, which collects and process raw natural gas, remove waste products, and separate economic components, primarily natural gas liquids; and provides gas handling services and other ancillary services, such as NGL extraction, NGL handling and loading services, and condensate stabilization. The Liquids Infrastructure segment owns and operates a network of facilities, including underground NGL storage caverns, above-ground storage tanks, NGL fractionation facilities, NGL, and condensate pipelines, as well as rail and truck terminals for the processing, fractionation, storage and transportation of the by-products of natural gas processing, including NGLs such as ethane, propane, butane and condensate; and engages in the liquids blending activities. The Marketing segment offers propane, butane, condensate, and iso-octane, as well as natural gas and crude oil. The company was formerly known as Keyera Facilities Income Fund and changed its name to Keyera Corp. in January 2011. Keyera Corp. was founded in 1998 and is headquartered in Calgary, Canada.
Financials
- Revenue (TTM)
- $6.39B
- EBITDA
- $913.12M
- Profit Margin
- 2.82%
- ROE (TTM)
- 6.71%
- EPS (Diluted)
- 0.79
- Book Value
- 11.01
Classification
- Sector
- Energy
- Industry
- Oil, Gas & Consumable Fuels
- Group
- Energy
💰 Recent Dividends
$0.5400
Ex: Dec 15, 2025
Pay: Dec 31
$0.5400
Ex: Sep 15, 2025
Pay: Sep 29
$0.5200
Ex: Jun 16, 2025
Pay: Jun 30
$0.5200
Ex: Mar 17, 2025
Pay: Mar 31
$0.2050
Ex: Mar 4, 2025
Pay: Mar 14
$0.5200
Ex: Dec 13, 2024
Pay: Dec 31
$0.2050
Ex: Dec 3, 2024
Pay: Dec 13
$0.5200
Ex: Sep 13, 2024
Pay: Sep 27
$0.2050
Ex: Aug 27, 2024
Pay: Sep 13
$0.5000
Ex: Jun 14, 2024
Pay: Jun 28
Advertisement
7 stocks to buy and hold forever
Blue-chip dividend stocks for long-term wealth building.
Get the FREE ReportExplore More
Common Questions About KEY
Articles Featuring KEY.TO
Latest articles and analysis covering KEY.TO
What's Going On With Keyera Corp. Stock Wednesday?
Keyera Corp. has seen a steady increase in its stock price this week, reflecting its strategic initiatives in the energy sector. Recent activities, including significant financing and acquisitions, are contributing to investor interest.
Why Keyera Corp. stock is tanking today
Keyera Corp. saw its stock price drop by 1.80% today, closing at CA$57.20. This decline comes amid ongoing financial maneuvers that have left investors cautious about the company's future.
Why Keyera Corp. stock is rising today
Keyera Corp. (KEY.TO) has seen a 2.46% rise in stock price, closing at CA$58.77. This movement reflects positive investor sentiment, possibly linked to recent financial strategies and market positioning.

Keyera Corp. Secures $1 Billion in Senior Unsecured Notes — What It Means for Canadian Investors
Keyera Corp. is raising $1 billion through senior unsecured notes, aiming to enhance its financial position and support a recent pipeline acquisition.

Why Keyera Corp. stock is gaining today
Keyera Corp. is gaining traction in the market, buoyed by strategic acquisitions and positive analyst sentiment, suggesting a promising future for this energy infrastructure player.

Why Keyera Corp. stock is sliding today
Keyera Corp. is experiencing a downturn in its stock price following its recent acquisition of the KAPS Pipeline, raising concerns about its financial strategy and market positioning.

Why Keyera Corp. stock is tanking today
Keyera Corp. saw its stock price fall by 0.83% today, closing at CA$56.21. Despite recent positive analyst ratings and strategic developments, the market's reaction suggests caution among investors.

Why Keyera Corp. stock is sliding today
Keyera Corp. saw its stock price slide by 3.07% in the latest trading session, closing at CA$57.20. This decline may be linked to investor concerns about the company's high valuation and the broader energy market dynamics.

Keyera Corp. (KEY.TO) Surges 3.5% on Strategic Growth Outlook Announcement
Keyera Corp. saw a 3.5% rise in its stock price following the announcement of its Strategic Growth Outlook and 2026 guidance, signaling investor confidence.

Keyera's Q1 Loss and Director Exits: What It Means for Its New Plains NGL Acquisition
Keyera's recent quarterly loss and director exits raise questions about its future as it integrates Plains' NGL assets. Investors should weigh the potential growth against integration risks.
Keyera Expands Its Integrated Platform with Plains Acquisition Amid Q1 Losses
Keyera's Q1 earnings call revealed a strategic acquisition and mixed financial results, including a CAD 122 million net loss, raising questions about its immediate profitability.

Keyera Corp. Jumps 3.5% After Positive Regulatory Update
Keyera Corp. saw a 3.5% increase in its stock price, driven by positive news regarding its acquisition of Plains' Canadian NGL business.
9 Best Monthly Dividend Stocks in Canada for July 2026
Are you looking for monthly income-paying investments outside of traditional fixed income like GICs or bonds? There are certain stocks that pay more frequent dividends, which can be a great addition to an income-focused portfolio. Only around 2% of dividend-paying, publicly-traded stocks pay their d
![9 Best Monthly Dividend Stocks in Canada for [currentmonthyearfull]](https://lhajohzwizrsjmumhpjg.supabase.co/storage/v1/object/public/wealth-awesome/site-media/best-monthly-dividend-stocks-in-canada_Whitecap-Resources-Inc.jpeg)
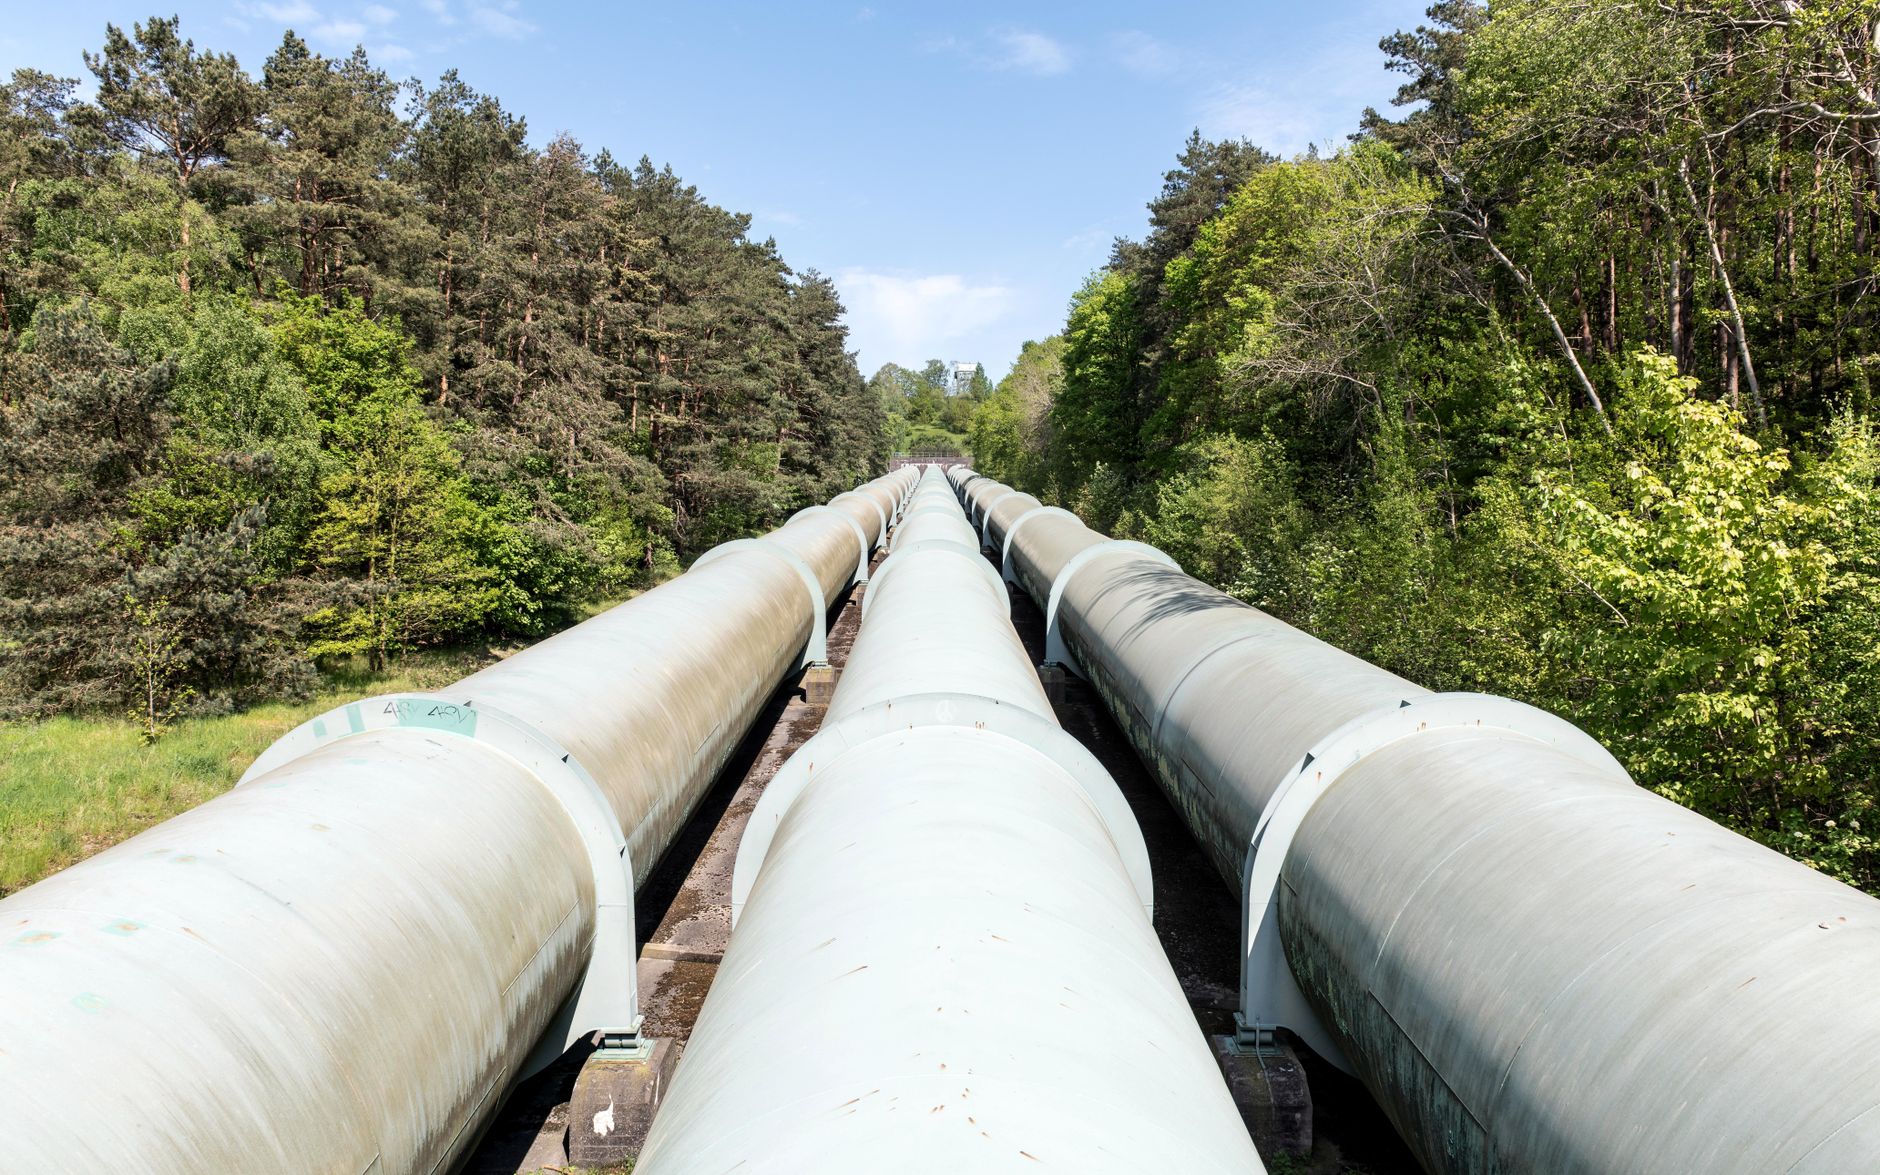
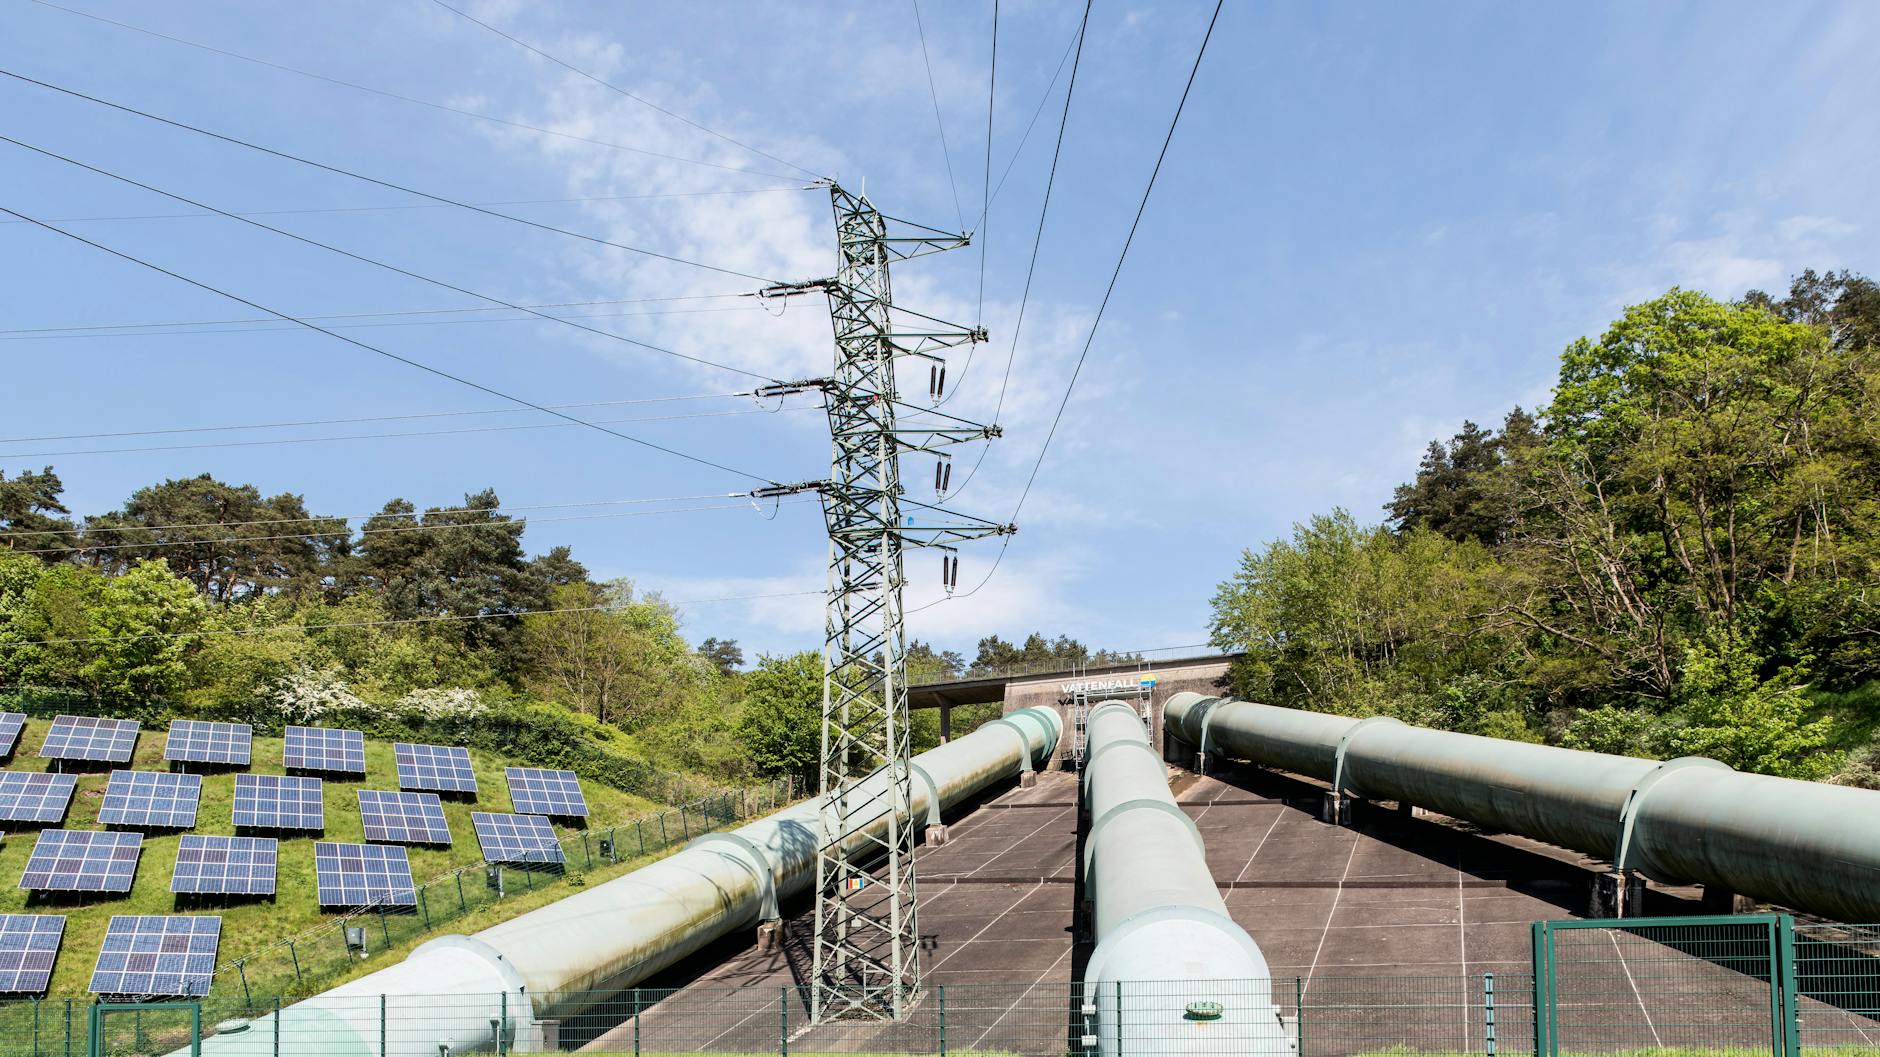
7 Best Pipeline Stocks in Canada for July 2026
Canada has a long and proud history when it comes to energy pipelines. In 1853, the world's largest natural gas pipeline was built in Quebec - a 25-kilometre cast iron marvel (At the time). One of the world's first oil pipelines was also built in Canada in 1862. Canada relies heavily on pipelines to
![7 Best Pipeline Stocks in Canada for [currentmonthyearfull]](https://lhajohzwizrsjmumhpjg.supabase.co/storage/v1/object/public/wealth-awesome/site-media/best-pipeline-stocks-in-canada_4-15-1024x538.jpg)