Northern Dynasty Minerals Ltd (NDM : TSX)
Common Stock
$2.27
CAD
-0.04 (-1.73%)
Last updated: 2026-07-20
NDM
Northern Dynasty Minerals Ltd
Performance
1 Day
-1.73%
1 Week
-2.16%
1 Month
-22.79%
YTD
-14.98%
Key Statistics
Market Cap
$1.29B
52W High
$4.19
52W Low
$1.00
P/E Ratio
-
50 Day MA
$2.78
200 Day MA
$2.60
Beta
0.55
Dividend Yield
-
Technical Indicators
Price vs 50-Day SMA
Price vs 200-Day SMA
Recent Price History
| Date | Open | High | Low | Close | Adj Close | Volume |
|---|---|---|---|---|---|---|
| 7/20/2026 | $2.32 | $2.33 | $2.25 | $2.27 | $2.27 | 412,338 |
| 7/17/2026 | $2.22 | $2.33 | $2.18 | $2.31 | $2.31 | 1,270,791 |
| 7/16/2026 | $2.30 | $2.32 | $2.22 | $2.25 | $2.25 | 1,361,782 |
| 7/15/2026 | $2.44 | $2.48 | $2.31 | $2.38 | $2.38 | 454,109 |
| 7/14/2026 | $2.36 | $2.47 | $2.32 | $2.46 | $2.46 | 673,312 |
| 7/13/2026 | $2.38 | $2.38 | $2.26 | $2.32 | $2.32 | 590,764 |
| 7/10/2026 | $2.45 | $2.47 | $2.38 | $2.40 | $2.40 | 461,661 |
| 7/9/2026 | $2.33 | $2.48 | $2.32 | $2.47 | $2.47 | 396,749 |
| 7/8/2026 | $2.30 | $2.35 | $2.19 | $2.29 | $2.29 | 1,121,574 |
| 7/7/2026 | $2.60 | $2.60 | $2.35 | $2.36 | $2.36 | 1,557,911 |
Analyst Price Targets
Based on analyst covering NDM
Wall Street analysts forecast NDM stock price to fall 64.8% over the next 12 months.
Consensus
BearishBased on avg. target vs last close (formal rating unavailable for Canadian listings)
Avg. Target
C$0.80
-64.8% Upside
Current Price
C$2.27
Last close
Analyst ratings and price targets are updated periodically. Not financial advice.
Wealth Awesome Price Forecast
WA ModelStatistical 90-day price range based on NDM's historical volatility
30-Day Vol
74.3%
Annualized
90-Day Vol
80.1%
Annualized
Trend (90d)
-50.0%
Annualized drift
90d Mean
C$1.90
Expected price
| Horizon | Expected | 68% Range (1σ) |
|---|---|---|
| 30 trading days | C$2.14 | C$1.66 – C$2.76 |
| 60 trading days | C$2.02 | C$1.40 – C$2.90 |
| 90 trading days | C$1.90 | C$1.22 – C$2.96 |
Methodology: Range is calculated using 30-day realized volatility via geometric Brownian motion (log-normal model). 68% band = ±1σ, 95% band = ±2σ. This is a statistical model, not a prediction. Past volatility does not guarantee future results. Not financial advice.
About Northern Dynasty Minerals Ltd
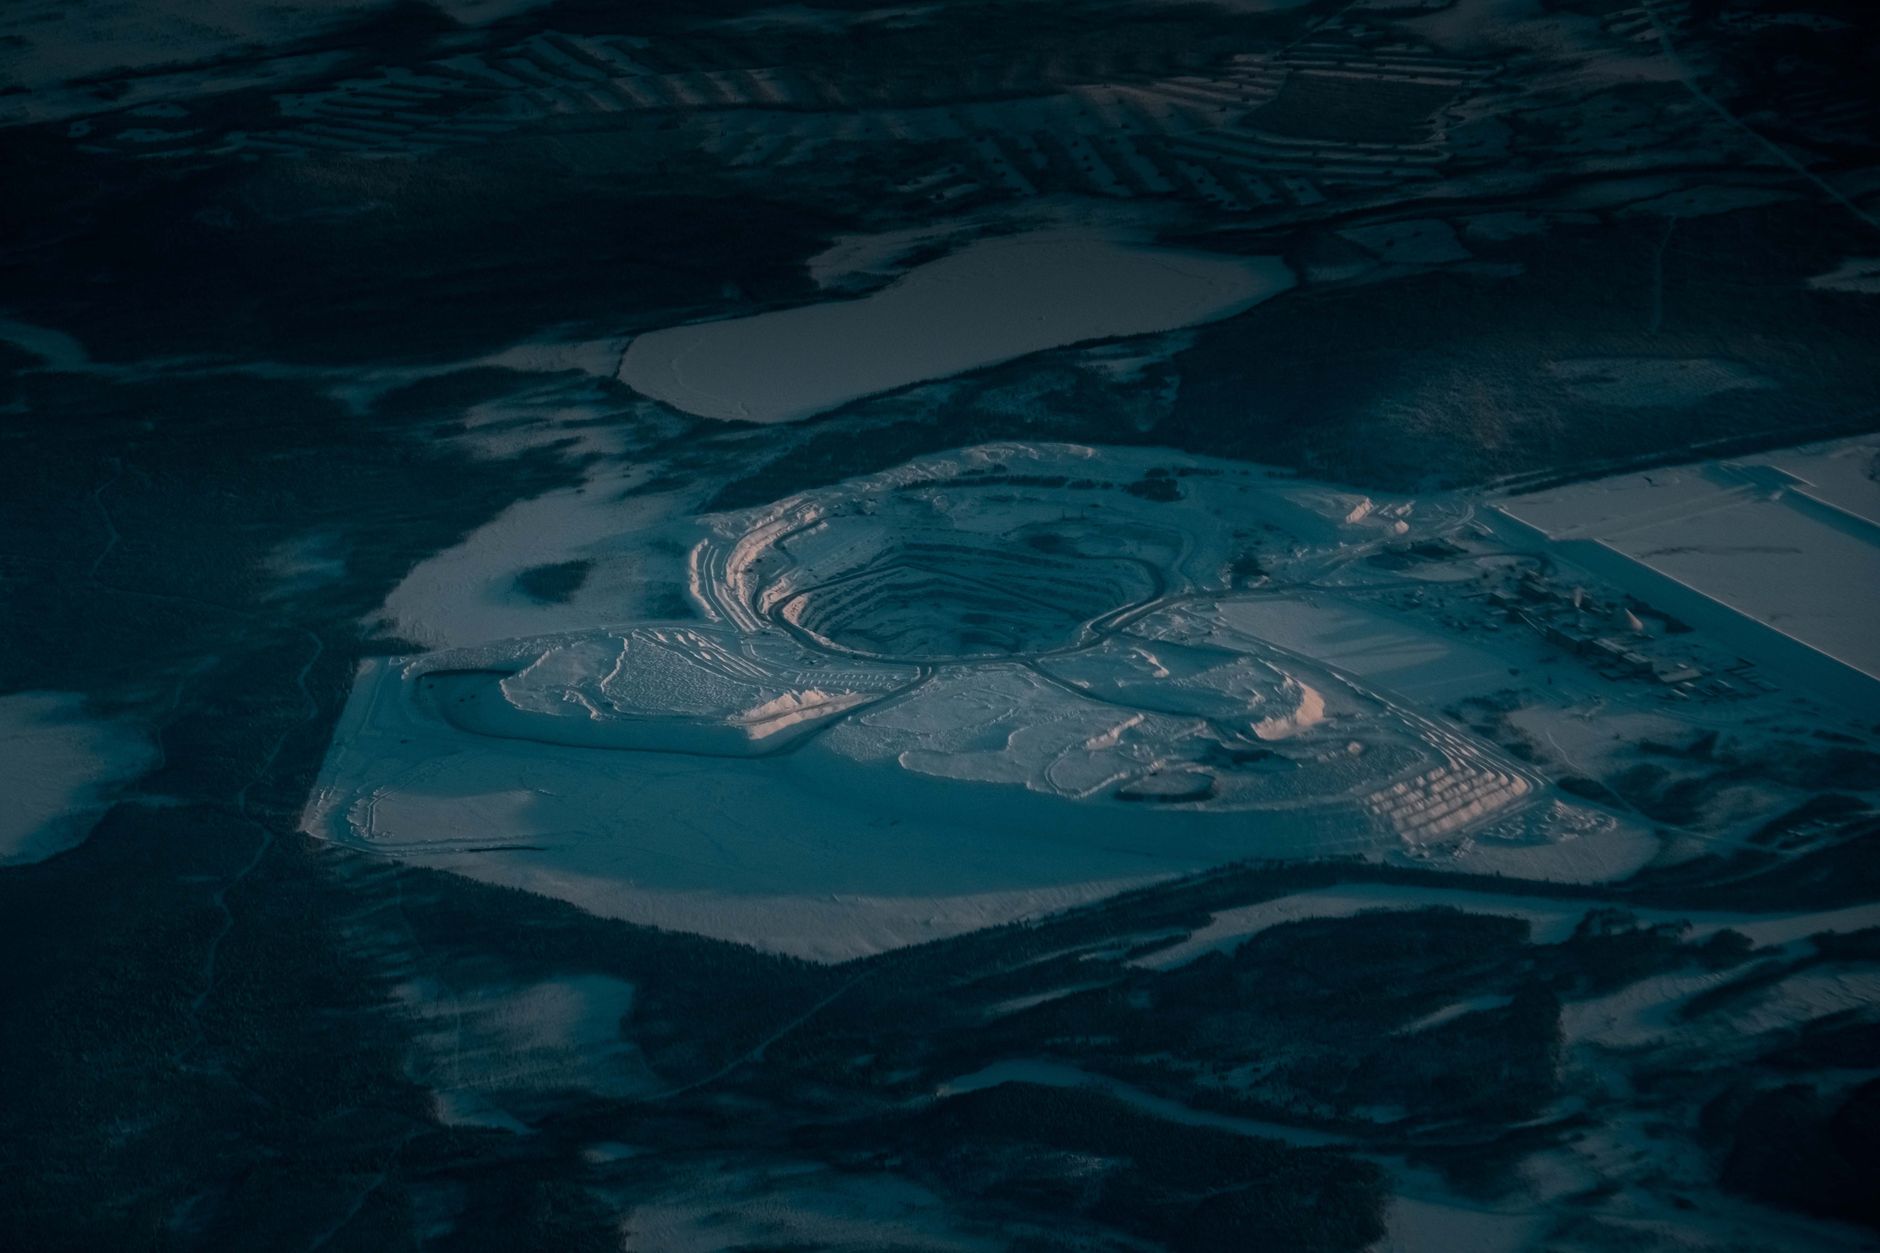
Northern Dynasty Minerals Ltd. engages in the acquisition, exploration, and development of mineral properties in the United States. It primarily explores copper, gold, molybdenum, silver, and rhenium deposits. The company holds 100% interest in the Pebble Copper-Gold-Molybdenum-Silver-Rhenium project comprising 1,840 mineral claims that covers an area of approximately 274 square miles located in southwest Alaska, the United States. The company was formerly known as Northern Dynasty Explorations Ltd. and changed its name to Northern Dynasty Minerals Ltd. in October 1997. Northern Dynasty Minerals Ltd. was incorporated in 1983 and is based in Vancouver, Canada.
Financials
- Revenue (TTM)
- $0
- EBITDA
- $-23.63M
- Profit Margin
- 0.00%
- ROE (TTM)
- -86.37%
- EPS (Diluted)
- -0.10
- Book Value
- 0.08
Classification
- Sector
- Materials
- Industry
- Metals & Mining
- Group
- Materials
Advertisement
7 stocks to buy and hold forever
Blue-chip dividend stocks for long-term wealth building.
Get the FREE ReportExplore More
Common Questions About NDM
Articles Featuring NDM.TO
Latest articles and analysis covering NDM.TO
Why Northern Dynasty Minerals Ltd stock is rising today
Northern Dynasty Minerals Ltd is seeing a rise of 3.96% in its stock today, closing at CA$2.36. This performance may indicate a shift in investor sentiment as the company navigates its ongoing legal issues.

Why Northern Dynasty Minerals Ltd stock is sliding today
Northern Dynasty Minerals Ltd experienced a 3.25% drop in its stock price, closing at CA$2.38. This decline raises questions about the company's stability, particularly in light of its recent financial filings and ongoing project developments.

What's Going On With Northern Dynasty Minerals Ltd Stock Thursday?
Northern Dynasty Minerals Ltd's stock closed at C$2.38, reflecting a daily decline amid a mixed weekly performance. Recent corporate updates, including annual filings and governance changes, may influence investor sentiment moving forward.
Why Northern Dynasty Minerals Ltd stock is skyrocketing today
Northern Dynasty Minerals Ltd's stock has seen a notable increase today, climbing 6.03% to close at CA$2.46. This rise occurs in a context where investor interest in mining stocks is on the rise, suggesting a potential bullish trend for the company.

Why Northern Dynasty Minerals Ltd stock is plummeting today
Northern Dynasty Minerals Ltd's stock has plummeted by 5.21% in today's trading session, closing at CA$2.27. The decline raises questions about the company's future amid ongoing challenges.

Why Northern Dynasty Minerals Ltd stock is skyrocketing today
Northern Dynasty Minerals Ltd (NDM.TO) saw its stock price soar by 7.86% in the last trading session, closing at CA$2.47. This surge may be attributed to investor optimism following recent financial disclosures and strategic investments.

Why Northern Dynasty Minerals Ltd stock is skyrocketing today
Northern Dynasty Minerals Ltd's stock has soared by 5.24% today, closing at CA$2.41, driven by positive investor sentiment following its recent corporate developments.

Why Northern Dynasty Minerals Ltd stock is plummeting today
Northern Dynasty Minerals Ltd (NDM.TO) experienced a notable decline of 10.94% in its stock price today, closing at CA$2.36. This downturn reflects market concerns regarding the company's stability and future prospects.

Why Northern Dynasty Minerals Ltd stock is skyrocketing today
Northern Dynasty Minerals Ltd has experienced a notable increase in its stock price today, rising by 5.51% to close at CA$2.77. This movement suggests a renewed investor confidence in the company's future prospects.
Why Northern Dynasty Minerals Ltd stock is sliding today
Northern Dynasty Minerals Ltd's stock has experienced a significant decline, prompting investors to reassess the company's future in a challenging market environment.

Why Northern Dynasty Minerals Ltd stock is sliding today
Northern Dynasty Minerals Ltd's stock fell by 4.24% in the last trading session, closing at CA$2.71. This decline raises concerns about the company's financial health and market position.

Why Northern Dynasty Minerals Ltd stock is skyrocketing today
Northern Dynasty Minerals Ltd's stock has seen a significant uptick today, closing at CA$2.83, marking a 5.99% increase. This movement is noteworthy for investors keeping an eye on the mining sector.

Why Northern Dynasty Minerals Ltd stock is rising today
Northern Dynasty Minerals Ltd shares rose by 3.75% in the latest trading session, closing at CA$2.77. This increase may indicate a positive shift in investor sentiment towards the company, despite the absence of specific news.
Why Northern Dynasty Minerals Ltd stock is plummeting today
Northern Dynasty Minerals Ltd's stock price fell sharply today, raising alarms about its financial health. Investors are left wondering about the future as the company faces scrutiny following recent filings.
Why Northern Dynasty Minerals Ltd stock is plummeting today
Northern Dynasty Minerals Ltd's stock has plummeted by 6.47% today, closing at CA$2.60. The decline raises alarms about the company's financial stability following its recent annual filings, which included a concerning audit report.

Why Northern Dynasty Minerals Ltd stock is sliding today
Northern Dynasty Minerals Ltd's stock slid by 2.68% today, closing at CA$2.90. The decline raises questions about the company's financial health and future prospects.

Why Northern Dynasty Minerals Ltd stock is tanking today
Northern Dynasty Minerals Ltd's stock has experienced a downturn, closing down 1.00% without any significant news to justify the drop. This raises questions about the company's stability and future performance.

Why Northern Dynasty Minerals Ltd stock is sliding today
Northern Dynasty Minerals Ltd saw its stock price decline by 3.58% in the last trading session, closing at CA$2.96. This drop underscores the challenges facing the company as it navigates regulatory hurdles and investor sentiment.

Why Northern Dynasty Minerals Ltd stock is sliding today
Northern Dynasty Minerals Ltd's stock slid 3.58% in the last trading session, closing at CA$2.96, raising concerns about its financial stability amid recent filings.

Why Northern Dynasty Minerals Ltd stock is skyrocketing today
Northern Dynasty Minerals Ltd (NDM.TO) saw its stock price soar by 8.10% in the last trading session, closing at CA$3.07. This increase may indicate a renewed interest from investors, despite the company's ongoing financial challenges.
Showing latest 20 articles