Acadian Timber Corp (ADN : TSX)
Common Stock
$17.33
CAD
-0.06 (-0.35%)
Last updated: 2026-07-20
Dividend Declared
22 days ago$0.2900 CAD per share dividend. Ex-dividend date: June 30, 2026
ADN
Acadian Timber Corp
Performance
1 Day
-0.35%
1 Week
-0.40%
1 Month
-2.37%
YTD
+10.66%
Key Statistics
Market Cap
$320.95M
52W High
$17.99
52W Low
$13.28
P/E Ratio
6.49
50 Day MA
$17.52
200 Day MA
$16.54
Beta
0.50
Dividend Yield
6.77%
Technical Indicators
Price vs 50-Day SMA
Price vs 200-Day SMA
Recent Price History
| Date | Open | High | Low | Close | Adj Close | Volume |
|---|---|---|---|---|---|---|
| 7/20/2026 | $17.39 | $17.41 | $17.12 | $17.33 | $17.33 | 8,786 |
| 7/17/2026 | $17.30 | $17.41 | $17.24 | $17.39 | $17.39 | 8,239 |
| 7/16/2026 | $17.19 | $17.40 | $17.09 | $17.13 | $17.13 | 22,515 |
| 7/15/2026 | $17.35 | $17.41 | $17.08 | $17.08 | $17.08 | 19,296 |
| 7/14/2026 | $17.78 | $17.78 | $17.29 | $17.34 | $17.34 | 21,695 |
| 7/13/2026 | $17.88 | $17.88 | $17.36 | $17.40 | $17.40 | 13,181 |
| 7/10/2026 | $17.55 | $17.89 | $17.52 | $17.68 | $17.68 | 4,133 |
| 7/9/2026 | $17.61 | $17.75 | $17.60 | $17.69 | $17.69 | 3,269 |
| 7/8/2026 | $17.61 | $17.66 | $17.50 | $17.65 | $17.65 | 2,082 |
| 7/7/2026 | $17.45 | $17.63 | $17.44 | $17.63 | $17.63 | 4,960 |
Analyst Price Targets
Based on analyst covering ADN
Wall Street analysts forecast ADN stock price to rise 5.3% over the next 12 months.
Consensus
Moderately BullishBased on avg. target vs last close (formal rating unavailable for Canadian listings)
Avg. Target
C$18.25
+5.3% Upside
Current Price
C$17.33
Last close
Analyst ratings and price targets are updated periodically. Not financial advice.
Wealth Awesome Price Forecast
WA ModelStatistical 90-day price range based on ADN's historical volatility
30-Day Vol
13.3%
Annualized
90-Day Vol
11.9%
Annualized
Trend (90d)
+6.8%
Annualized drift
90d Mean
C$17.76
Expected price
| Horizon | Expected | 68% Range (1σ) |
|---|---|---|
| 30 trading days | C$17.47 | C$16.69 – C$18.29 |
| 60 trading days | C$17.61 | C$16.51 – C$18.79 |
| 90 trading days | C$17.76 | C$16.40 – C$19.22 |
Methodology: Range is calculated using 30-day realized volatility via geometric Brownian motion (log-normal model). 68% band = ±1σ, 95% band = ±2σ. This is a statistical model, not a prediction. Past volatility does not guarantee future results. Not financial advice.
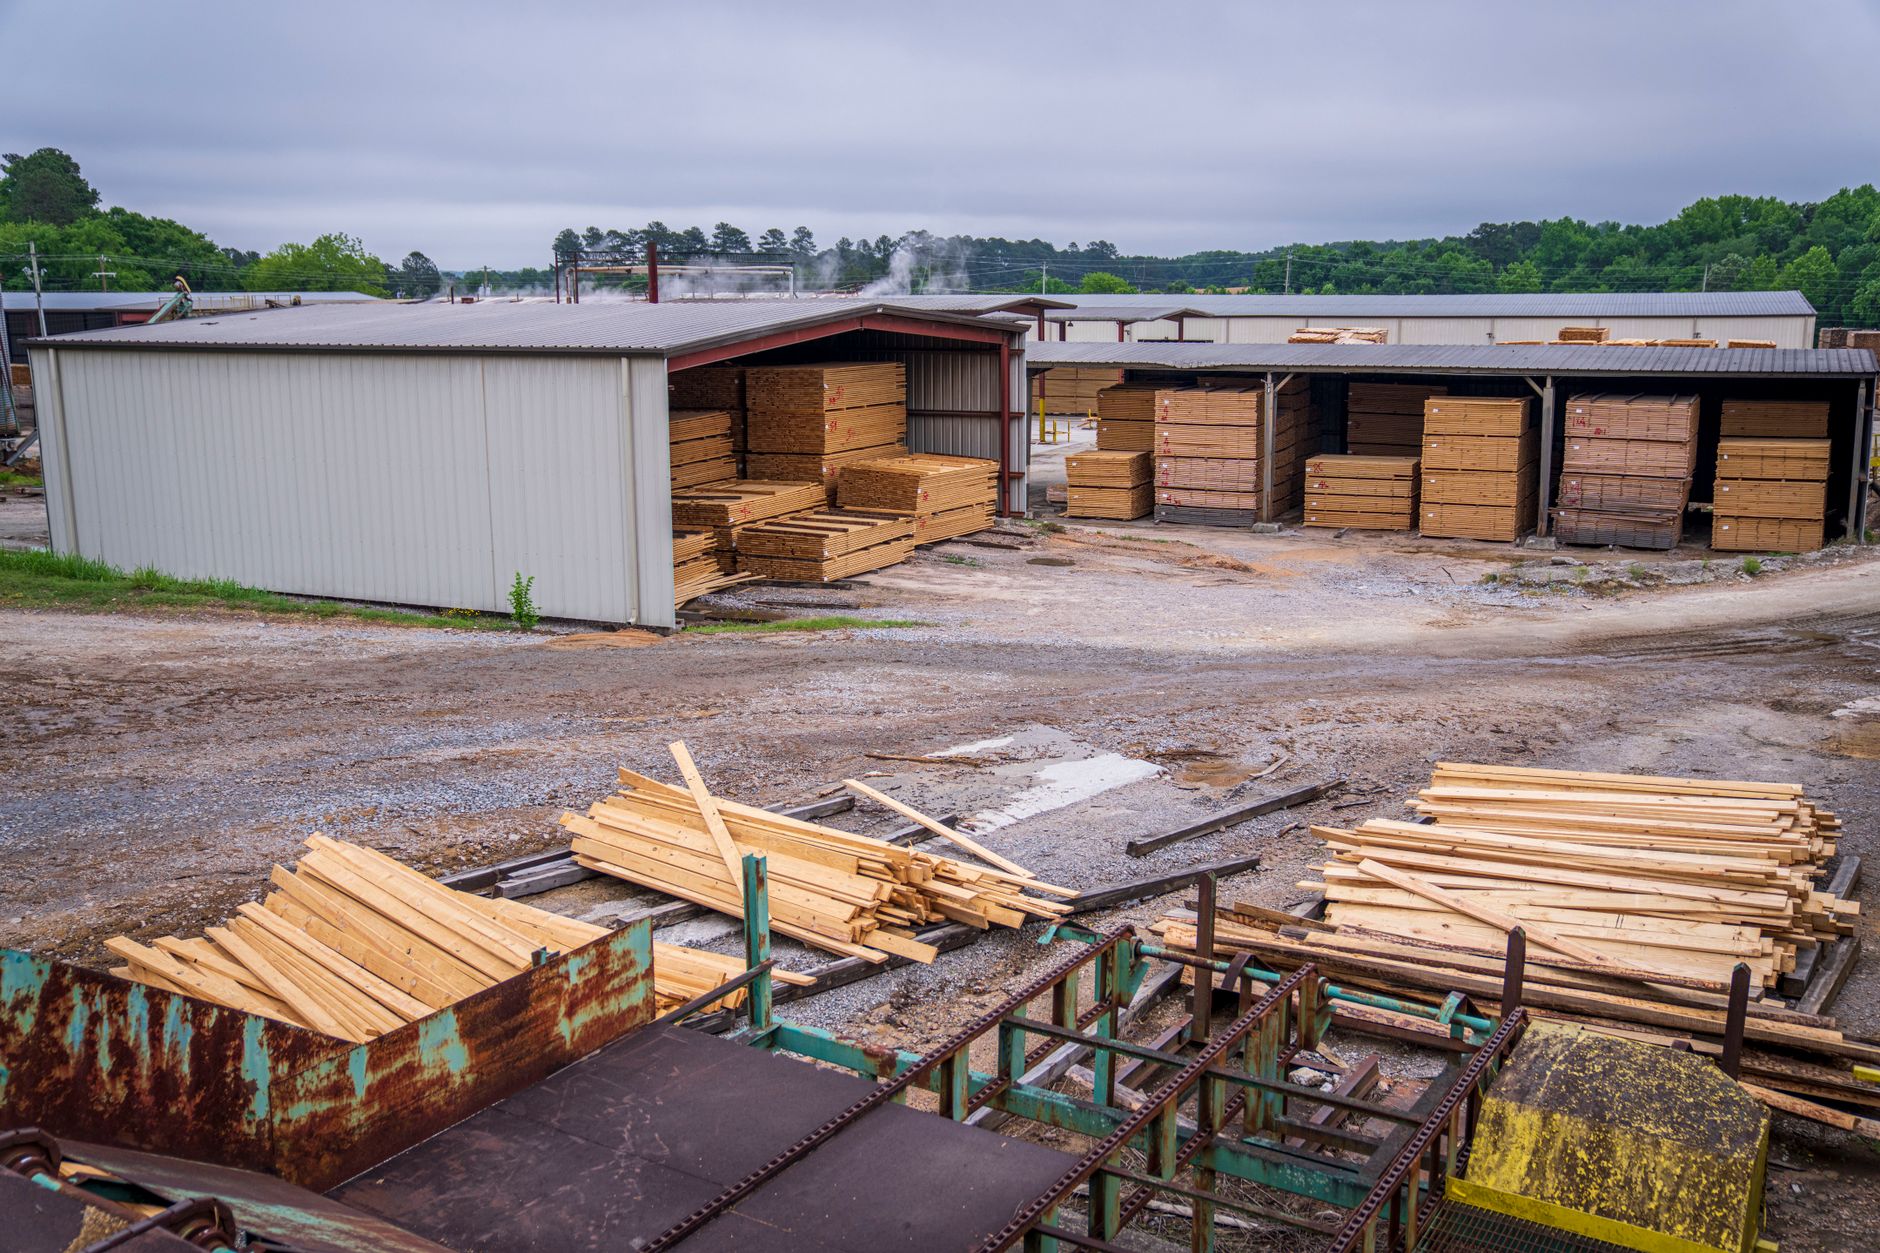
About Acadian Timber Corp
Acadian Timber Corp., together with its subsidiaries, provides forest products in Eastern Canada and the Northeastern United States. The company operates through New Brunswick Timberlands, Maine Timberlands, and Environmental Solutions segments. It offers timber products, such as softwood and hardwood sawlogs, pulpwood, and biomass by-products. The company also owns and manages freehold timberlands in New Brunswick and Maine; and provides timber services relating to Crown licensed timberlands in New Brunswick. In addition, it provides forest management and environmental solutions; and engages in real estate activities. Acadian Timber Corp. was founded in 2006 and is headquartered in Edmundston, Canada.
Financials
- Revenue (TTM)
- $85.53M
- EBITDA
- $15.33M
- Profit Margin
- 57.04%
- ROE (TTM)
- 13.91%
- EPS (Diluted)
- 2.68
- Book Value
- 19.59
Classification
- Sector
- Materials
- Industry
- Paper & Forest Products
- Group
- Materials
💰 Recent Dividends
$0.2900
Ex: Jun 30, 2026
$0.2900
Ex: Dec 31, 2025
Pay: Jan 15
$0.2900
Ex: Sep 29, 2025
Pay: Oct 15
$0.2900
Ex: Jun 30, 2025
Pay: Jul 15
$0.2900
Ex: Mar 31, 2025
Pay: Apr 15
$0.2900
Ex: Dec 31, 2024
Pay: Jan 15
$0.2900
Ex: Sep 27, 2024
Pay: Oct 15
$0.2900
Ex: Jun 28, 2024
Pay: Jul 15
$0.2900
Ex: Mar 27, 2024
Pay: Apr 15
$0.2900
Ex: Dec 28, 2023
Pay: Jan 15
Advertisement
7 stocks to buy and hold forever
Blue-chip dividend stocks for long-term wealth building.
Get the FREE ReportExplore More
Common Questions About ADN
Articles Featuring ADN.TO
Latest articles and analysis covering ADN.TO
What's Going On With Acadian Timber Corp Stock Monday?
Acadian Timber Corp (ADN.TO) has seen a slight uptick in its stock price today, amidst a backdrop of modest weekly declines. The company is set to hold a conference call in July 2026, which may impact investor sentiment moving forward.
What's Going On With Acadian Timber Corp Stock Monday?
Acadian Timber Corp's stock has faced slight declines this week, closing at C$17.40. Despite this, the company has shown solid performance year-to-date, supported by strategic investments and stable operational results.
Why Acadian Timber Corp stock is tanking today
Acadian Timber Corp's stock has seen a notable decline of 0.94% in the last trading session, closing at CA$17.83. Investors are left questioning the company's resilience in the face of market challenges.

Why Acadian Timber Corp stock is gaining today
Acadian Timber Corp's stock gains 0.90% today, closing at CA$18.00, driven by its solid financial metrics and market positioning.

Why Acadian Timber Corp stock is gaining today
Acadian Timber Corp is gaining traction with a 0.45% increase in stock price, reflecting its stable operations and strategic investments in the timber industry.

Top 10 Canadian Dividend Stocks to Buy Now
Looking for reliable dividend income in Canada? Here's a quick guide to the top 10 Canadian dividend stocks for 2025, offering steady payouts and growth potential. These stocks are listed on the TSX, making them eligible for the Canadian dividend tax credit, which can reduce your tax burden compared

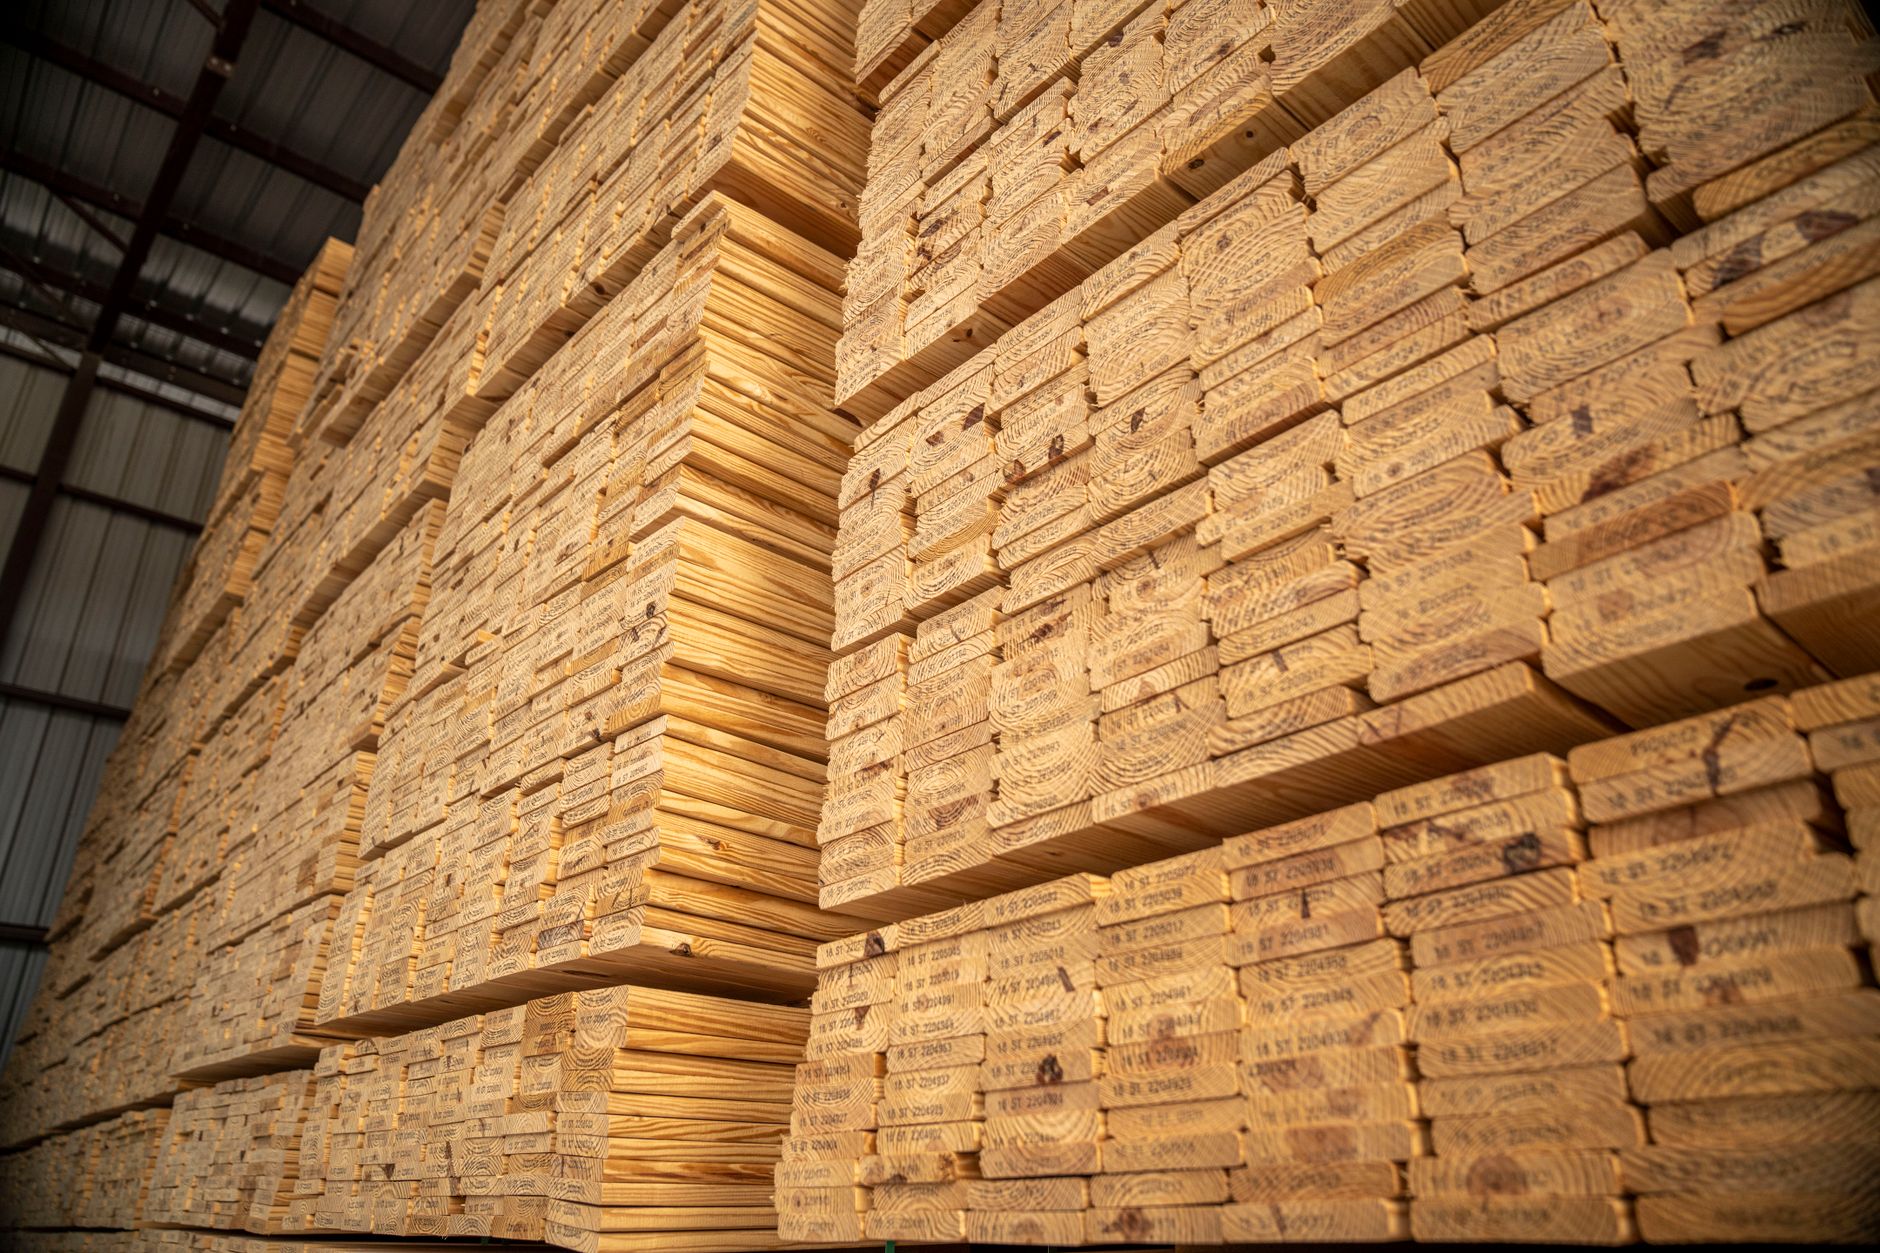
6 Best Forestry Stocks In Canada for July 2026
About 90% of homes in America are built with wood. It's a stark contrast to most other countries in the world. In Europe, only about 7% of the total housing stock comprised of wood by about 2006. However, the trend there is changing, and most of the new constructions (about 80%) of the new construct
![6 Best Forestry Stocks In Canada for [currentmonthyearfull]](https://lhajohzwizrsjmumhpjg.supabase.co/storage/v1/object/public/wealth-awesome/site-media/best-forestry-stocks-in-canada_2-50.jpg)