Restaurant Brands International Inc (QSR : TSX)
Common Stock
$104.05
CAD
-1.13 (-1.07%)
Last updated: 2026-07-20
QSR
Restaurant Brands International Inc
Performance
1 Day
-1.07%
1 Week
-2.70%
1 Month
-1.34%
YTD
+11.71%
Key Statistics
Market Cap
$48.00B
52W High
$110.62
52W Low
$81.75
P/E Ratio
23.80
50 Day MA
$104.30
200 Day MA
$99.71
Beta
0.53
Dividend Yield
2.32%
Technical Indicators
Price vs 50-Day SMA
Price vs 200-Day SMA
Recent Price History
| Date | Open | High | Low | Close | Adj Close | Volume |
|---|---|---|---|---|---|---|
| 7/20/2026 | $105.34 | $105.87 | $103.87 | $104.05 | $104.05 | 437,846 |
| 7/17/2026 | $109.00 | $109.13 | $104.96 | $105.18 | $105.18 | 1,220,971 |
| 7/16/2026 | $104.81 | $108.65 | $104.81 | $108.29 | $108.29 | 740,491 |
| 7/15/2026 | $104.76 | $106.30 | $103.77 | $104.19 | $104.19 | 450,879 |
| 7/14/2026 | $106.58 | $107.15 | $104.90 | $104.94 | $104.94 | 386,367 |
| 7/13/2026 | $106.91 | $107.95 | $106.67 | $106.94 | $106.94 | 1,038,497 |
| 7/10/2026 | $106.33 | $107.56 | $105.66 | $106.57 | $106.57 | 276,532 |
| 7/9/2026 | $105.46 | $106.76 | $104.38 | $106.22 | $106.22 | 952,661 |
| 7/8/2026 | $104.60 | $105.50 | $102.95 | $105.37 | $105.37 | 1,007,449 |
| 7/7/2026 | $105.31 | $107.94 | $104.74 | $104.96 | $104.96 | 1,164,649 |
Analyst Price Targets
Based on analyst covering QSR
Wall Street analysts forecast QSR stock price to rise 8.6% over the next 12 months.
Consensus
Moderately BullishBased on avg. target vs last close (formal rating unavailable for Canadian listings)
Avg. Target
C$113.00
+8.6% Upside
Current Price
C$104.05
Last close
Analyst ratings and price targets are updated periodically. Not financial advice.
Wealth Awesome Price Forecast
WA ModelStatistical 90-day price range based on QSR's historical volatility
30-Day Vol
26.7%
Annualized
90-Day Vol
25.7%
Annualized
Trend (90d)
-28.1%
Annualized drift
90d Mean
C$94.13
Expected price
| Horizon | Expected | 68% Range (1σ) |
|---|---|---|
| 30 trading days | C$100.63 | C$91.79 – C$110.33 |
| 60 trading days | C$97.32 | C$85.45 – C$110.85 |
| 90 trading days | C$94.13 | C$80.26 – C$110.38 |
Methodology: Range is calculated using 30-day realized volatility via geometric Brownian motion (log-normal model). 68% band = ±1σ, 95% band = ±2σ. This is a statistical model, not a prediction. Past volatility does not guarantee future results. Not financial advice.
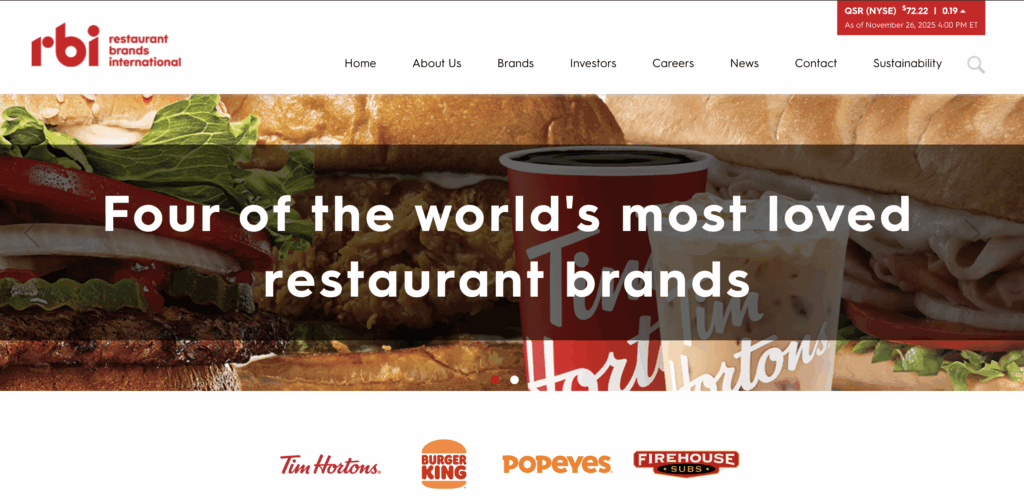
About Restaurant Brands International Inc
Restaurant Brands International Inc. operates as a quick service restaurant company in Canada, the United States, and internationally. It operates through six segments: Tim Hortons, Burger King, Popeyes Louisiana Kitchen, Firehouse Subs, International, and Restaurant Holdings. The company owns and franchises Tim Hortons, a coffee and baked good restaurant chain that offers beverages, sandwiches, wraps, flatbread pizzas, and others; Burger King, a quick service hamburger restaurant chain that offers flame-grilled hamburgers, chicken, and other sandwiches; Popeyes, a quick service chicken concept that offers a Louisiana style menu, including fried bone-in chicken, chicken sandwiches, chicken tenders, wings, fried shrimp, and regional items; and Firehouse Subs, which offers subs with meats and cheese, as well as chili, soups, soft drinks, and other sides. Restaurant Brands International Inc. was founded in 1954 and is headquartered in Miami, Florida.
Financials
- Revenue (TTM)
- $9.59B
- EBITDA
- $2.87B
- Profit Margin
- 9.96%
- ROE (TTM)
- 28.14%
- EPS (Diluted)
- 4.42
- Book Value
- 15.28
Classification
- Sector
- Consumer Discretionary
- Industry
- Hotels, Restaurants & Leisure
- Group
- Consumer Services
💰 Recent Dividends
$0.8530
Ex: Dec 23, 2025
Pay: Jan 6
$0.8570
Ex: Sep 23, 2025
Pay: Oct 7
$0.8510
Ex: Jun 24, 2025
Pay: Jul 8
$0.8880
Ex: Mar 21, 2025
Pay: Apr 4
$0.8350
Ex: Dec 20, 2024
Pay: Jan 3
$0.7860
Ex: Sep 20, 2024
Pay: Oct 4
$0.7940
Ex: Jun 21, 2024
Pay: Jul 5
$0.7870
Ex: Mar 20, 2024
Pay: Apr 4
$0.7330
Ex: Dec 20, 2023
Pay: Jan 4
$0.7420
Ex: Sep 19, 2023
Pay: Oct 4
Advertisement
7 stocks to buy and hold forever
Blue-chip dividend stocks for long-term wealth building.
Get the FREE ReportExplore More
Common Questions About QSR
Articles Featuring QSR.TO
Latest articles and analysis covering QSR.TO
Why Restaurant Brands International Inc stock is sliding today
Restaurant Brands International Inc's stock slid 2.87% today, closing at CA$105.18. This decline highlights investor caution as the company navigates its growth strategy amid economic pressures.
Why Restaurant Brands International Inc stock is rising today
Restaurant Brands International Inc (QSR.TO) saw a notable increase in its stock price, closing up 3.94% in the latest trading session. This uptick comes amid broader industry trends and strategic initiatives that are positioning the company for future growth.

What's Going On With Restaurant Brands International Inc Stock Thursday?
Restaurant Brands International Inc (QSR.TO) has faced a slight decline this week, with current trading at C$108.29. Recent news highlights the competitive landscape and strategic considerations for the company.

Why Restaurant Brands International Inc stock is rising today
Restaurant Brands International Inc (QSR.TO) has seen a notable stock increase of 2.77% today, driven by strategic initiatives aimed at enhancing profitability and customer engagement in a competitive market.

Why Restaurant Brands International Inc stock is gaining today
Restaurant Brands International Inc (QSR.TO) is gaining traction with a 1.57% increase in its stock price today, driven by positive earnings results and strong market positioning. As the fast-food sector navigates challenges, this stock remains a point of interest for investors.

Why Restaurant Brands International Inc stock is gaining today
Restaurant Brands International Inc (QSR.TO) is experiencing a notable gain today, driven by positive analyst sentiment and strategic operational improvements. Investors are optimistic about the company's ability to enhance customer experience and increase market share.

Why Restaurant Brands International Inc stock is tanking today
Restaurant Brands International Inc (QSR.TO) experienced a 0.99% decline in stock price today, raising questions about its competitive edge in a rapidly evolving market. As Starbucks gains ground with improved customer service, investors are left to ponder the future of QSR.TO.

Why Restaurant Brands International Inc stock is tanking today
Restaurant Brands International Inc (QSR.TO) is under pressure today, with shares slipping 0.88% as the company faces increased competition and mixed analyst sentiments regarding its growth strategy.
Why Restaurant Brands International Inc stock is gaining today
Restaurant Brands International Inc (QSR.TO) has shown a positive performance in today's trading, reflecting investor confidence amidst a competitive landscape. With strategic marketing initiatives and solid earnings, the company is navigating challenges effectively.

Why Restaurant Brands International Inc stock is gaining today
Restaurant Brands International Inc (QSR.TO) has gained 1.48% in the last trading session, driven by strong quarterly earnings and innovative marketing campaigns. The company reported an adjusted EPS increase of 14.7% year-over-year, showcasing its operational strength despite recent challenges.

Restaurant Brands International Inc Gains 3% in Last Session Amid Positive Market Sentiment
Restaurant Brands International Inc's stock jumped 3% in the last session, reflecting growing investor confidence in the restaurant sector.

Tims China Brews Up Q4 Results Call: What Investors Should Know
Tims China is set to release its Q4 and full-year 2025 results, with investors eager to assess its performance in a competitive market. Key metrics suggest a mixed outlook.

Buy Canadian: TSX Stocks Look Set to Outperform Global Markets Next Year
Brands (TSX:QSR). Restaurant Brands International (RBI), the parent of Tim Hortons, Burger King, Popeyes, and Firehouse Subs, is riding a wave of strong sentiment and solid growth expectations: - Share price is holding near its 52-week high, with a 5-day pop of +6.3%, signalling renewed investor con
Top 60 CEO Salaries in Canada
From banking and telecommunications to mining, retail, and renewable energy, Canada’s leading CEOs command immense responsibilities—and compensation packages to match. These executives steer the country’s top publicly traded companies, influencing economies and innovation across the TSX Composite In
10 Best Restaurant Stocks In Canada (Jul 2026)
Canada has a little over 82,000 restaurants. That’s one restaurant for over 463 people in the country, though the distribution will differ significantly between urban and rural areas. The best restaurant stocks in Canada can prove to be relatively healthy long-term investments, and it's an asset cla
![10 Best Restaurant Stocks In Canada ([currentmonthyear])](https://lhajohzwizrsjmumhpjg.supabase.co/storage/v1/object/public/wealth-awesome/site-media/best-restaurant-stocks-in-canada_2-112.jpg)